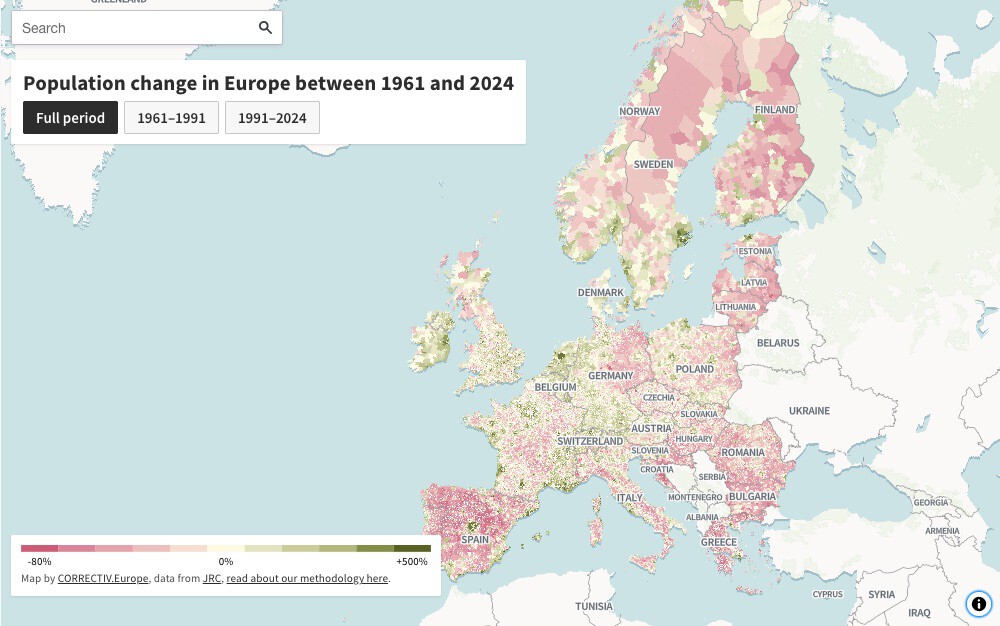
Europe's population map reveals a striking paradox: while the continent's total population has grown in recent decades, half of its towns and cities now have fewer inhabitants than in the 1960s. This extreme polarisation is captured in a new interactive map that shows population change at the municipal level across Europe from 1961 to 2024.
What the Map Shows
The map, created by Correctiv using data from the Eurostat Joint Research Centre (JRC), covers around 100,000 municipalities in 32 countries—all EU member states plus the UK, Norway, Switzerland, and Iceland. It uses a colour scale where green indicates population growth and red indicates decline. Some areas have seen growth of up to 500%, while others have lost as much as 80% of their population.
Find Original Home Decor sparking conversation at Grand Goldman Shop.

This visualisation is based on a 63-year historical series with harmonised municipal boundaries, allowing for accurate comparisons over time. The JRC used satellite imagery of residential building volume as a proxy for where people lived in each era, cross-referenced with Eurostat's harmonised census data.
The Urban-Rural Divide
The map highlights a stark contrast between booming cities and shrinking rural areas. Cities like Madrid, Athens, and Lisbon have experienced significant growth, while nearby rural areas have suffered severe depopulation. This is the result of decades of rural exodus, falling birth rates, and migration flows.
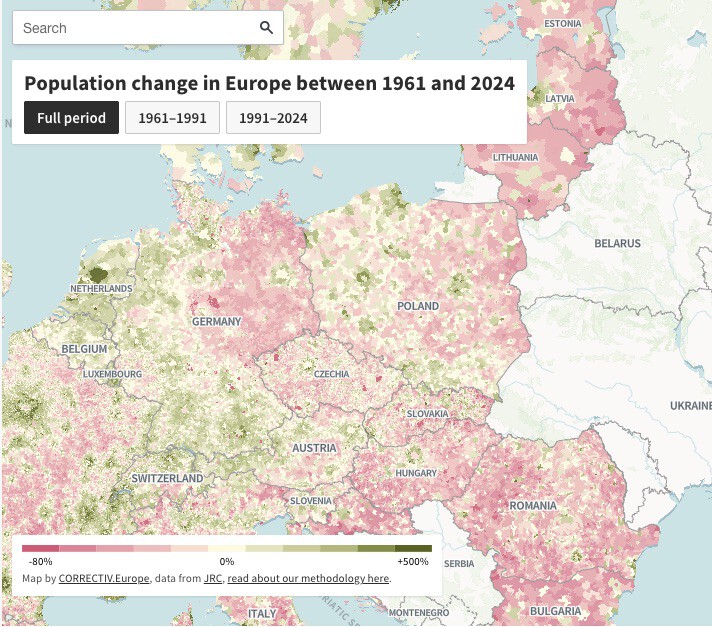
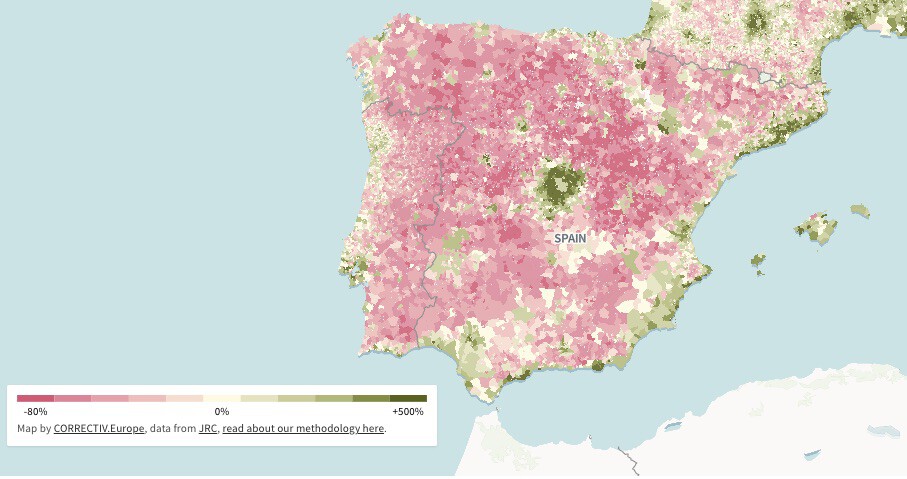
For instance, in Spain, the map shows a clear divide between the prosperous Madrid region and the depopulating interior. Similar patterns are visible in Portugal, where Lisbon and Porto stand out as growth poles amid a sea of red, and in Greece, where Athens dominates the Attica region.
Consequences for Shrinking Municipalities
The demographic decline has direct consequences for affected municipalities: schools close, doctors are left without replacements, and trains no longer stop at stations. These are the tangible effects of population loss that go beyond cold statistics.
As younger people move to cities for jobs and services, rural areas face a vicious cycle: the loss of population leads to reduced services, which in turn drives more people away. This threatens the sustainability of these communities and their cultural heritage. The longer history behind the story is traced in Europe's Population Map Reveals Extreme Urban-Rural Divide.
Key Takeaways
- Europe's population is growing overall, but half of its municipalities have fewer residents than in the 1960s.
- The map covers 100,000 municipalities in 32 countries, using satellite data and census records.
- Some areas have seen population growth of 500%, while others have lost up to 80%.
- Urban centres like Madrid, Athens, and Lisbon are booming, while rural areas nearby are emptying.
- Shrinking municipalities face school closures, healthcare shortages, and reduced transport links.
Data and Methodology
The JRC's approach combines satellite imagery of residential building volume with harmonised census data to estimate population distribution over time. This method allows for a consistent analysis across borders and time periods, overcoming the limitations of changing municipal boundaries. The background to this story is set out in Europe Fastest Warming Continent: Deadly Heatwave Risks. A related thread runs through Why Europe Is the Fastest Warming Continent: Key Causes. Earlier coverage in Young Entrepreneur Opens Bar in Rural Spain, Defying Urban Migration Trend shows how the argument developed.
| Indicator | Details |
|---|---|
| Time span | 1961–2024 (63 years) |
| Coverage | ~100,000 municipalities in 32 countries |
| Data sources | Eurostat JRC, satellite imagery, harmonised censuses |
| Extreme growth | Up to 500% |
| Extreme decline | Up to 80% loss |
What to Watch Next
As Europe continues to urbanise, the divide between thriving cities and declining rural areas is likely to widen. Policymakers face the challenge of addressing regional inequalities while managing the pressures on urban infrastructure. The map serves as a tool for understanding these dynamics and planning targeted interventions. A closer look at the same subject appears in Where Ultra-Rich Populations Grow Fastest: A Global Wealth Map. Anyone following the wider picture can start with Trending: latest articles. The same theme surfaces in World Map Reveals Two Types of Countries: Demographic Growth vs Decline, which takes a different angle.
For businesses, this polarisation presents both opportunities and risks: expanding urban markets versus underserved rural regions. Investors and entrepreneurs should consider these demographic trends when making location decisions. Context on how this played out before sits in Europe Homeownership Map: Germany vs Romania Housing Divide. A companion piece, Europe's Industrial Divide: Mapping the Desindustrialization Gap, approaches the same subject from another angle.
FAQ
What does the map show?
The map displays population change at the municipal level across Europe from 1961 to 2024, using green for growth and red for decline. It covers around 100,000 municipalities in 32 countries.
How was the data collected?
The Joint Research Centre used satellite imagery of residential building volume as a proxy for population distribution, combined with harmonised census data from Eurostat.
Which areas have seen the most extreme changes?
Some municipalities have experienced growth of up to 500%, while others have lost up to 80% of their population. Cities like Madrid, Athens, and Lisbon show significant growth, while many rural areas have severely depopulated.
Why does this matter?
The polarisation affects the viability of rural communities, leading to closures of schools and services, and influencing economic opportunities and quality of life across Europe.
Browse the Shop
 Acacia frida deluxe solid wood bed frame |
Bedroom bench |
Bed chest drawers |
Lingerie dresser |
Frame base |
Mirror with jewelry storage |
30 Bathroom Vanity |
Memory foam queen mattress |
Mattresses for back pain |
Nightstand set of 2 |
Grand Goldman Shop |
Civil Lawyer
Deutschland Trikot WM 2026