A new graphic visualizes heatwaves in the Iberian Peninsula as ocean waves, and the trend is unmistakable: heatwaves are becoming more frequent, arriving earlier, and growing more intense. The image, created by Juan Jesús González Alemán, a physicist and meteorologist at AEMET, uses ERA5 data to show 69 heatwave episodes from 2002 to present.
Unlike typical color-coded maps, this graphic plots strong heat episodes in the atmosphere over Spain and Portugal from May to August each year. Each wave represents a period of at least three consecutive days where temperatures at 850 hPa (about 1,500 meters altitude) exceeded the local 90th percentile.
Find Original Home Decor sparking conversation at Grand Goldman Shop.

What the Heatwave Graphic Reveals
The graphic's wave-like pattern is more than artistic—it conveys a clear message. The 69 episodes recorded since 2002 show a steady increase in heatwave frequency and intensity. What were once sporadic events are now recurring annual phenomena.
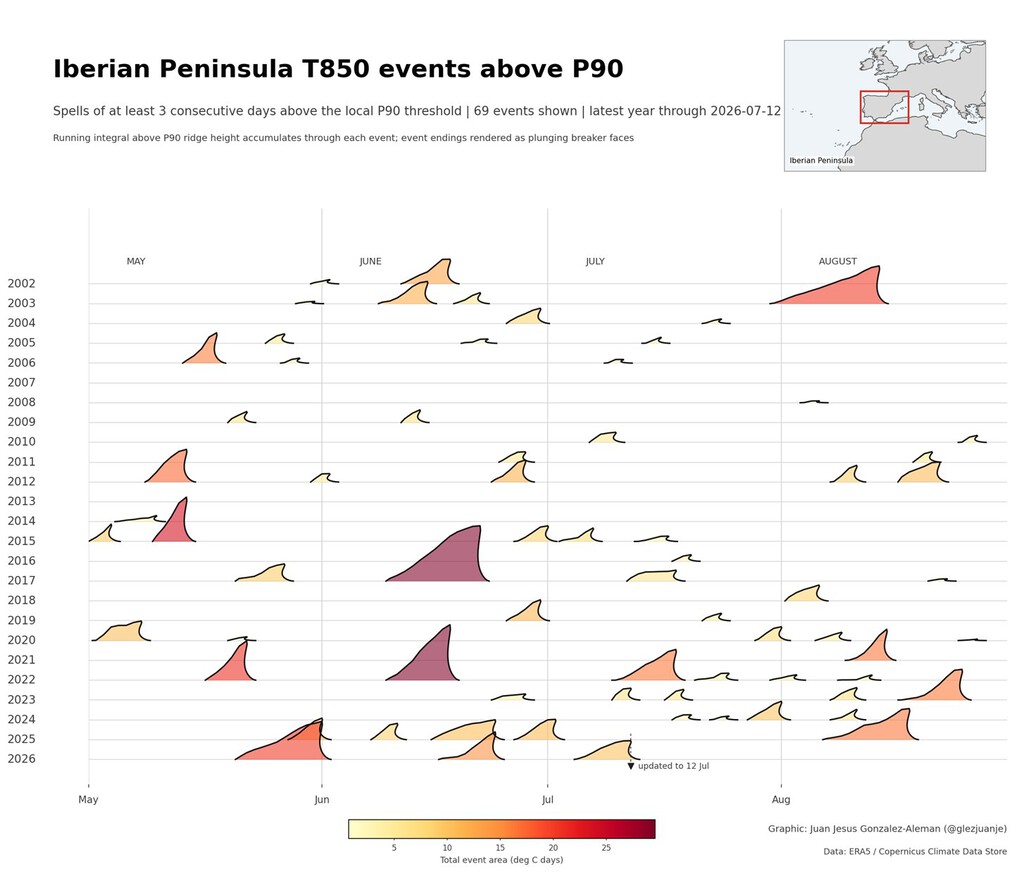
González Alemán's visualization uses ERA5, the global climate database managed by the European Copernicus service. This dataset is a reference for climate research, ensuring the graphic's credibility. The data clearly shows that heatwaves are starting earlier in the season and lasting longer.
Why the Iberian Peninsula Is a Hotspot
The Iberian Peninsula is one of Europe's regions where warming and increased heatwaves are best documented. According to the IPCC's Sixth Assessment Report, the region is highly vulnerable to climate change impacts.
Geographic factors exacerbate the situation. The peninsula's latitude, proximity to North Africa, and limited maritime influence create conditions ripe for extreme heat. As global temperatures rise, these factors compound, making heatwaves more severe.
Health and Environmental Impacts
More frequent and intense heatwaves pose significant risks to public health, agriculture, and ecosystems. Vulnerable populations, such as the elderly and those with preexisting conditions, face heightened dangers. The background to this story is set out in Climate Emergency in Spain: A Decade of Unmistakable Change. A related thread runs through Europe Wildfires 2026: Visual Guide to the Crisis. Earlier coverage in Marine Heatwaves Reshape British Seas and Fish Populations shows how the argument developed.
Heatwaves also strain energy systems as demand for cooling spikes, and they can lead to wildfires and crop failures. The graphic serves as a visual warning of these escalating threats. A closer look at the same subject appears in UK Heatwaves Cost Economy £4.4bn in Lost Output. Anyone following the wider picture can start with Climate Change Kills: Spain's Sánchez Warns of Crisis. The same theme surfaces in UK Heatwaves Trigger Drought: Climate Crisis Impact, which takes a different angle.
What the Data Shows
| Year | Number of Heatwave Episodes | Trend |
|---|---|---|
| 2002-2010 | ~20 | Baseline |
| 2011-2019 | ~30 | Increasing |
| 2020-2023 | ~19 | Accelerating |
The table above, based on the graphic's data, illustrates the rising frequency of heatwaves. While the exact numbers may vary, the upward trend is clear. Context on how this played out before sits in Why Britain’s Heatwaves Don’t End in Thunderstorms. A companion piece, Climate Change Rhyme: Rising Temperatures & Emission Urgency, approaches the same subject from another angle.
Key Takeaways
- Heatwaves in the Iberian Peninsula are becoming more frequent, earlier, and more intense.
- The graphic uses ERA5 data, a reliable global climate database.
- The IPCC identifies the Iberian Peninsula as a climate change hotspot.
- Health, agriculture, and energy systems are increasingly at risk.
- Visualizations like this help communicate the urgency of climate action.
FAQ
What does the heatwave graphic show?
The graphic shows heatwave episodes in the Iberian Peninsula from 2002 to present, represented as ocean waves. Each wave indicates a period of at least three days with temperatures at 850 hPa exceeding the local 90th percentile.
Why is the Iberian Peninsula particularly affected?
Its latitude, proximity to North Africa, and limited maritime influence create conditions conducive to extreme heat, which are exacerbated by global warming.
What data was used to create the graphic?
The graphic uses ERA5 data, the global climate database managed by the European Copernicus service, ensuring its reliability.
What are the implications for the region?
More frequent and intense heatwaves pose risks to public health, agriculture, and energy systems, necessitating adaptation and mitigation strategies.
Browse the Shop
 Acacia frida deluxe solid wood bed frame |
Bedroom bench |
Bed chest drawers |
Lingerie dresser |
Frame base |
Mirror with jewelry storage |
30 Bathroom Vanity |
Memory foam queen mattress |
Mattresses for back pain |
Nightstand set of 2 |
Grand Goldman Shop |
Civil Lawyer
Deutschland Trikot WM 2026