The map "A Walk Through Time" reveals the epic 200,000-year journey of human migration from Africa to the Americas. Created by cartographer Jeff Blossom at Harvard's Center for Geographic Analysis in 2013, this visualization synthesizes our species' long trek across the globe.
It answers a fundamental question: when, how, and where did our ancestors move? The map shows that all modern humans trace their origins to Africa and that it took 200,000 years to populate every corner of the world.
Find Original Home Decor sparking conversation at Grand Goldman Shop.

What the Map Shows
The map uses a Dymaxion projection (also known as the Fuller projection) to stretch the world map without cutting any ocean. This unusual orientation and coloring serve a purpose: to highlight the continuous journey of human migration.
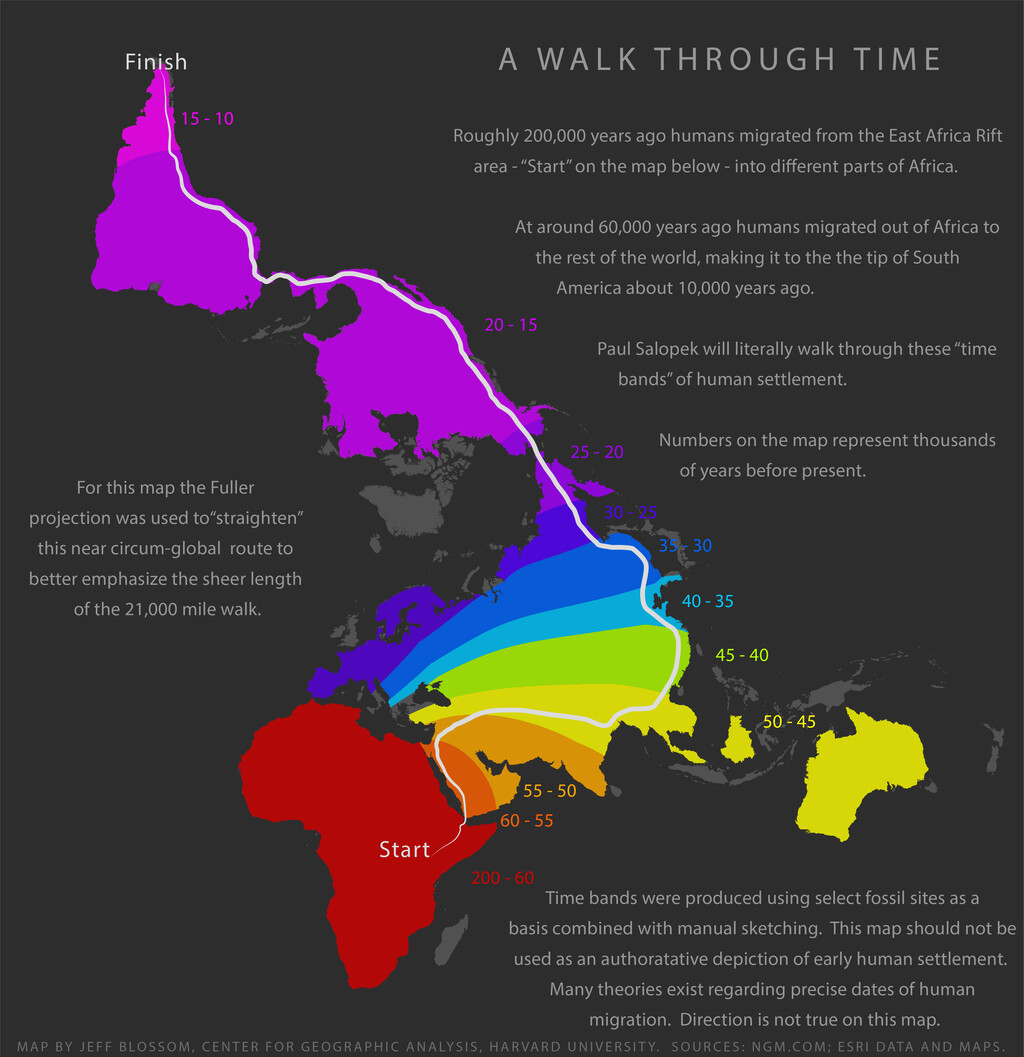
Colors follow a rainbow spectrum, with red representing the oldest migration waves (around 200,000 years ago in Africa) and magenta indicating the most recent (about 10,000 years ago in the Americas). The years marked on the map are in thousands of years before present, showing when humans first arrived in each region.
Why This Map Matters
This map is more than a pretty picture; it visually confirms what science has long demonstrated: all modern humans (Homo sapiens) descend from a single African population. It condenses thousands of scientific papers into one accessible image.
By presenting the migration timeline, the map helps us grasp the scale and duration of our ancestors' journey. It also underscores our shared origins, fostering a sense of global unity.
Key Takeaways from the Migration Map
- African origin: All modern humans originated in Africa around 200,000 years ago.
- Gradual dispersal: Migration happened in waves over tens of thousands of years.
- Global reach: Humans reached the Americas approximately 10,000 years ago.
- Visual timeline: The map's color coding provides an intuitive way to understand migration chronology.
- Scientific consensus: The map aligns with genetic and archaeological evidence supporting the Out of Africa theory.
The Science Behind the Map
The map draws on data from National Geographic Maps and ESRI's geospatial layers. It was created for the Out of Eden Walk project, a National Geographic initiative that follows journalist Paul Salopek as he retraces our ancestors' migration route on foot.
Such visualizations are powerful tools for science communication, making complex data accessible to the public. They also help researchers communicate hypotheses and findings more effectively.
How to Read the Map
To interpret the map, start at the red areas in Africa, which indicate the earliest human presence. As you follow the colors toward yellow, green, and finally magenta, you trace the paths our ancestors took as they spread across continents.
The numbers on the map (e.g., 200, 100, 50) represent thousands of years before present. For instance, 100 means 100,000 years ago. This timeline helps you understand the pace of migration.
Comparing Migration Timelines
Different regions were populated at different times. The table below summarizes key milestones in human migration based on the map's data.
| Region | Approximate Time of Arrival (Years Ago) | Color on Map |
|---|---|---|
| Africa | 200,000 | Red |
| Middle East | 100,000 | Orange |
| Europe | 50,000 | Yellow |
| Asia | 60,000 | Yellow-Green |
| Australia | 50,000 | Green |
| Americas | 10,000 | Magenta |
These dates are approximate and based on current scientific understanding, but they illustrate the general pattern of migration. The background to this story is set out in GPS-Tracked Elephant Maps 12,000 km Migration Route Across Africa. A related thread runs through Australia's 99 All Out Collapse Leaves South Africa in Sight. Earlier coverage in The Surprising History of Milk: From Ancient Taboo to Modern Staple shows how the argument developed.
Implications for Our Understanding of Humanity
The map reinforces the idea that we are all migrants. It challenges notions of static identities and highlights our shared heritage. In a world often divided by borders, this perspective is more relevant than ever. A closer look at the same subject appears in The Surprising History of Air Conditioning: From Ancient Cooling to Modern AC. Anyone following the wider picture can start with From Ancient Glass Panes to Modern Glass Walls: A History of Windows. The same theme surfaces in Sweden's Post-Brexit Migration Policy Sparks Human Rights Questions, which takes a different angle.
Moreover, the map serves as an educational tool, inspiring curiosity about our past and the journeys that shaped us. It reminds us that human history is a story of movement and adaptation. Context on how this played out before sits in Best UK Universities for Classics & Ancient History: League Table. A companion piece, Nepal Hydropower Rescue: Triumph for Humanity, approaches the same subject from another angle.
FAQ
What is the "A Walk Through Time" map?It is a cartographic visualization created by Jeff Blossom in 2013 that shows the migration routes of early humans from Africa to the rest of the world over 200,000 years. It uses a Dymaxion projection and color coding to represent different time periods.
It is a cartographic visualization created by Jeff Blossom in 2013 that shows the migration routes of early humans from Africa to the rest of the world over 200,000 years. It uses a Dymaxion projection and color coding to represent different time periods.
Why does the map use a Dymaxion projection?The Dymaxion projection (or Fuller projection) stretches the world map into a shape that avoids cutting any oceans, allowing the viewer to see the migration routes as continuous paths without breaks.
The Dymaxion projection (or Fuller projection) stretches the world map into a shape that avoids cutting any oceans, allowing the viewer to see the migration routes as continuous paths without breaks.
What do the colors on the map represent?The colors follow a rainbow spectrum: red indicates the oldest human presence (around 200,000 years ago in Africa), while magenta represents the most recent migration (about 10,000 years ago in the Americas).
The colors follow a rainbow spectrum: red indicates the oldest human presence (around 200,000 years ago in Africa), while magenta represents the most recent migration (about 10,000 years ago in the Americas).
How accurate is the map's timeline?The map is based on current scientific consensus and data from National Geographic and ESRI. While dates are approximate and subject to revision as new evidence emerges, the general pattern of migration is well-supported by genetic and archaeological research.
The map is based on current scientific consensus and data from National Geographic and ESRI. While dates are approximate and subject to revision as new evidence emerges, the general pattern of migration is well-supported by genetic and archaeological research.
Browse the Shop
 Acacia frida deluxe solid wood bed frame |
Bedroom bench |
Bed chest drawers |
Lingerie dresser |
Frame base |
Mirror with jewelry storage |
30 Bathroom Vanity |
Memory foam queen mattress |
Mattresses for back pain |
Nightstand set of 2 |
Grand Goldman Shop |
Civil Lawyer
Deutschland Trikot WM 2026