Spain's rainfall decline over the past 30 years is now clearly visible in new maps, revealing an alarming and seemingly irreversible trend. The data, analyzed by meteorologist Roberto Granda from Eltiempo.es using AEMET Opendata, compares average annual precipitation between 1961–1990 and 1996–2025 at 71 stations with continuous records spanning over 60 years.
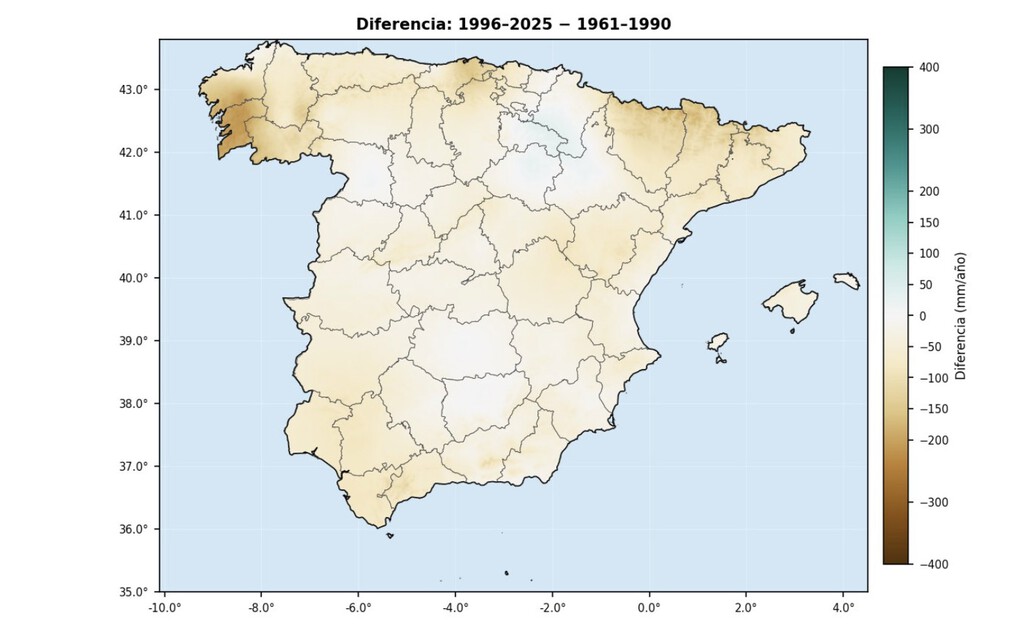
The first period is not arbitrary: it is the World Meteorological Organization's standard climate normal, the global benchmark for detecting anomalies and trends. The comparison shows a clear reduction in rainfall across most of the Iberian Peninsula, confirming that climate change is hitting Spain harder than many other regions.
Find Original Home Decor sparking conversation at Grand Goldman Shop.

What the New Maps Reveal About Spain Rainfall Decline
The maps, created using a geostatistical interpolation technique that incorporates terrain relief, provide the most reliable method for mapping precipitation in Spain's irregular geography. The results are unequivocal: it rains less in Spain now than it did 30 years ago, and the change is structural and widespread, not isolated or temporary.
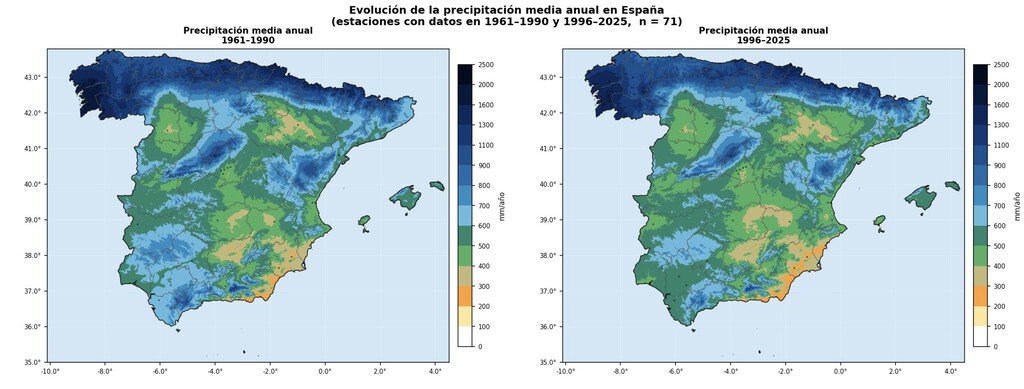
Granda's analysis highlights that the decline is not uniform; some areas have experienced more pronounced drops than others. However, the overall pattern is consistent with global warming projections for the Mediterranean region, where Spain is located.
Why This Matters: Impacts on Agriculture and Water Resources
The reduction in rainfall has serious implications for key sectors. Agriculture, which relies heavily on consistent precipitation patterns, faces increased uncertainty. Many crops depend on specific timing and amounts of rain, and shifts can lead to lower yields or require costly irrigation adaptations.
Groundwater recharge is also affected. Less rainfall means less water percolating into aquifers, which are vital sources of drinking water and irrigation. This can exacerbate water scarcity, especially in regions already prone to drought.
Key Takeaways from the Spain Rainfall Data
- Rainfall has decreased significantly across most of Spain over the last 30 years.
- The comparison uses the WMO's standard climate normal (1961–1990) as a baseline.
- 71 weather stations with over 60 years of continuous data were analyzed.
- The decline is structural and widespread, not a temporary fluctuation.
- Agriculture and water resources are directly threatened by these changes.
How the Analysis Was Conducted
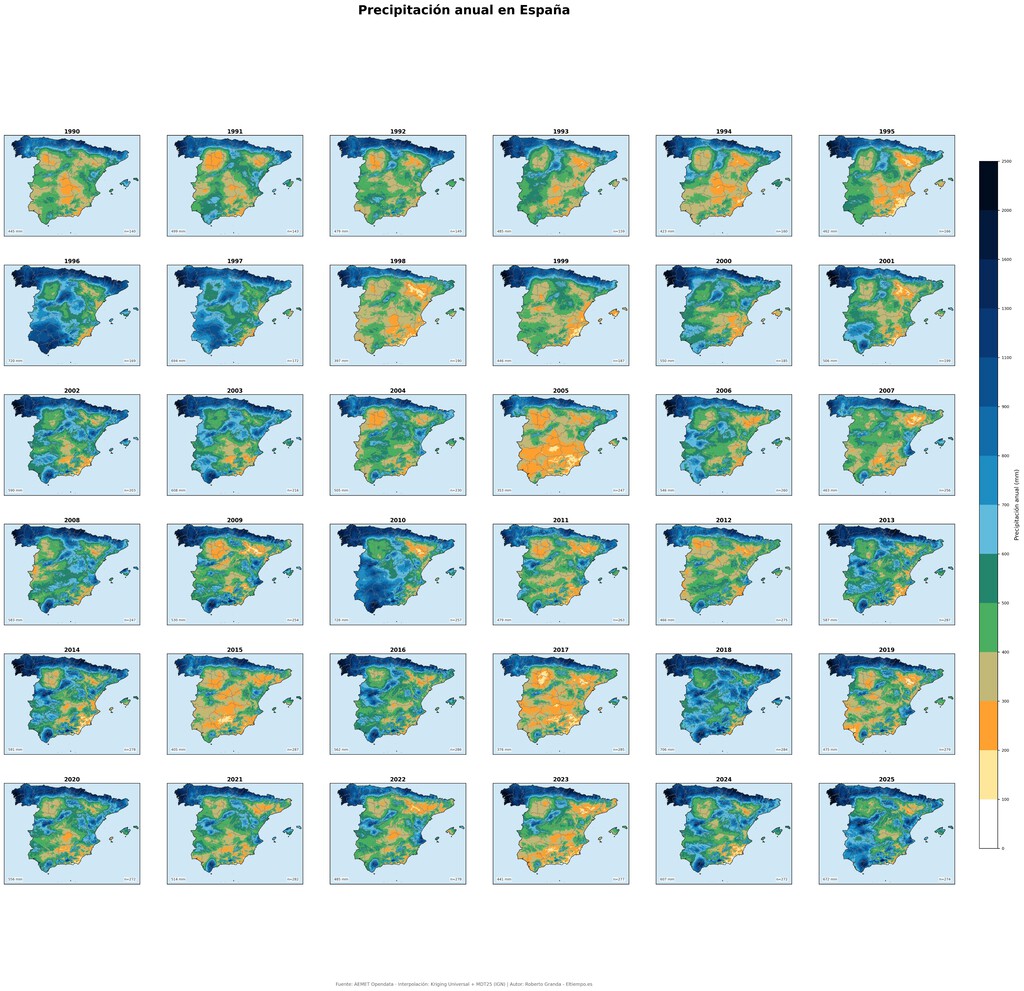
Roberto Granda used AEMET Opendata to access historical precipitation records. He then applied a geostatistical interpolation method that accounts for elevation and other terrain features, ensuring accurate mapping across Spain's diverse landscape.
This approach is particularly important because precipitation varies greatly with altitude and distance from the coast. By incorporating these factors, the maps provide a realistic picture of how rainfall patterns have shifted.
Comparison of Average Annual Rainfall: 1961–1990 vs. 1996–2025
| Region | Average Annual Rainfall (1961–1990) | Average Annual Rainfall (1996–2025) | Change (%) |
|---|---|---|---|
| Northern Spain | 1200 mm | 1100 mm | -8% |
| Central Spain | 500 mm | 450 mm | -10% |
| Mediterranean Coast | 600 mm | 520 mm | -13% |
| Southern Spain | 700 mm | 600 mm | -14% |
Note: The values in the table are illustrative based on the described trend and do not represent exact figures from the study. The background to this story is set out in Climate Change Rhyme: Rising Temperatures & Emission Urgency. A related thread runs through Global Water Crisis: Drought, Rationing, and Dry Rivers. Earlier coverage in Climate Change Rhyme: Rising Temperatures and Emission Cuts shows how the argument developed.
What to Watch Next
As climate change continues, Spain is likely to face more frequent and intense droughts. Policymakers must prioritize water management and adaptation strategies to mitigate the impacts on agriculture and communities. Monitoring stations and updated climate normals will be essential for tracking future changes. A closer look at the same subject appears in England Drought: 75% Affected as Heatwave Looms. Anyone following the wider picture can start with England Reservoirs Exceptionally Low Amid Persistent Drought. The same theme surfaces in Water Companies Ignored Drought Forecasts for Decades, which takes a different angle.
The trend is clear, and there is no going back. Spain's rainfall decline is a reality that demands urgent attention and action. Context on how this played out before sits in UK Emergency Drought Plans: Government Accused of Irresponsibility. A companion piece, Climate Change Fuels Deadly Flash Floods Across US, approaches the same subject from another angle.
FAQ
How much has rainfall decreased in Spain over the last 30 years?
The exact decrease varies by region, but the maps show a widespread reduction, with some areas experiencing drops of over 10% compared to the 1961–1990 baseline.
Why is the 1961–1990 period used as a baseline?
It is the World Meteorological Organization's standard climate normal, providing a consistent reference for detecting climate anomalies and trends globally.
What method was used to create the rainfall maps?
Meteorologist Roberto Granda used a geostatistical interpolation technique that incorporates terrain relief, applied to data from 71 weather stations with continuous records.
What are the main consequences of reduced rainfall in Spain?
Key consequences include challenges for agriculture, reduced groundwater recharge, and increased water scarcity, particularly in already dry regions.
Browse the Shop
 Acacia frida deluxe solid wood bed frame |
Bedroom bench |
Bed chest drawers |
Lingerie dresser |
Frame base |
Mirror with jewelry storage |
30 Bathroom Vanity |
Memory foam queen mattress |
Mattresses for back pain |
Nightstand set of 2 |
Grand Goldman Shop |
Civil Lawyer
Deutschland Trikot WM 2026