The price of housing in the EU has skyrocketed over the past decade, with increases ranging from 1.4% to a staggering 209.5%, according to a recent infographic from the European Parliament. This dramatic surge highlights the growing challenge of housing affordability across the 27 member states.
The data, based on the House Price Index from 2015 to 2024, reveals extreme disparities between countries. While some nations saw modest gains, others experienced explosive growth, making homeownership an increasingly distant dream for many citizens.
Find Original Home Decor sparking conversation at Grand Goldman Shop.

What the EU Housing Price Index Reveals
The House Price Index measures the price evolution of residential properties across the EU, using 2015 as the base year. It captures the percentage change in housing prices over the period, excluding Greece due to data limitations.
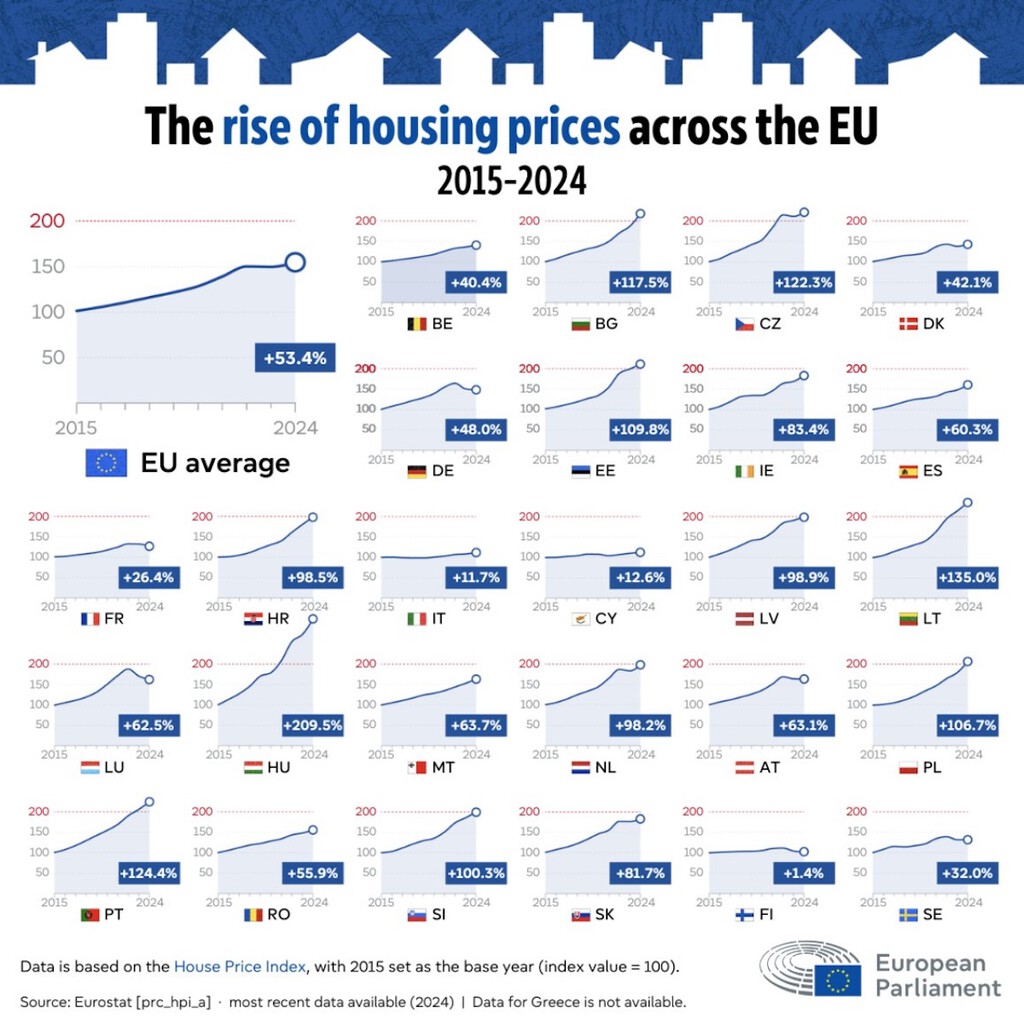
It's important to note that the index only tracks price changes—it does not account for affordability, nor does it distinguish between urban and rural areas or new versus existing homes. Nevertheless, it provides a clear picture of the magnitude of the housing crisis.
Countries with the Highest and Lowest Increases
Hungary leads the pack with an astonishing 209.5% increase, followed by other Central and Eastern European countries that have seen rapid price growth. On the other end, Finland recorded the smallest rise at just 1.4%.
This wide range underscores the divergent economic trajectories and housing market dynamics across the EU. Factors such as economic growth, investment flows, and housing supply constraints contribute to these differences.
Key Takeaways from the Data
- Hungary experienced the highest price surge at 209.5%.
- Finland saw the lowest increase at 1.4%.
- The index covers 2015 to 2024, with Greece excluded.
- Price changes vary widely across the 27 member states.
- The index does not measure affordability or housing type.
Why Housing Prices Have Surged
Several factors have driven the sharp increase in housing prices across the EU. Low interest rates for much of the period made borrowing cheaper, fueling demand. At the same time, housing supply has not kept pace with population growth and urbanization in many areas.
Additionally, investment in real estate as a safe haven asset, particularly during economic uncertainty, has pushed prices higher. The COVID-19 pandemic further exacerbated trends, with remote work increasing demand for larger homes in less dense areas.
These dynamics have created a perfect storm, making housing less affordable for first-time buyers and low-income households. The social implications are profound, as housing is a fundamental right and a cornerstone of a dignified life.
Impact on Homebuyers and the Economy
For ordinary citizens, the surge in housing prices means stretching budgets further or delaying homeownership. In countries like Hungary, where prices more than tripled, many have been priced out of the market entirely.
The economic impact is also significant. High housing costs can reduce consumer spending, limit labor mobility, and exacerbate inequality. Policymakers face the challenge of balancing market dynamics with social housing needs.
| Country | Price Change (2015-2024) | Notable Trend |
|---|---|---|
| Hungary | +209.5% | Highest increase in EU |
| Finland | +1.4% | Lowest increase in EU |
| Greece | Data not available | Excluded from index |
| EU Average | Varies by country | Wide disparities |
The table above illustrates the extreme contrast between the highest and lowest increases, highlighting the need for targeted housing policies.
What to Watch Next
As housing prices continue to rise, pressure mounts on governments to intervene. Potential measures include increasing housing supply, regulating short-term rentals, and providing subsidies for first-time buyers. The background to this story is set out in Housing Affordability Fix: Why Falling Prices Are Finally Working. A related thread runs through Australia's Housing Policy Tackles Root Cause of High House Prices. Earlier coverage in UK House Prices Flat in July as Buyers Face Affordability Squeeze shows how the argument developed.
However, any intervention must be carefully designed to avoid market distortions. The European Parliament's infographic serves as a wake-up call, emphasizing the urgency of addressing housing affordability across the EU. A closer look at the same subject appears in Falling House Prices: Young Homeowners Welcome Affordability Shift. Anyone following the wider picture can start with Spain Housing Prices Hit Record High Despite Falling Sales. The same theme surfaces in Asturias Housing Prices Surge 29.3%: Why the Region Leads Spain, which takes a different angle.
For now, buyers must navigate a challenging landscape. Staying informed about local market trends and policy changes is essential. The data from 2015 to 2024 shows no signs of a slowdown, making it crucial for stakeholders to collaborate on sustainable solutions. Context on how this played out before sits in Australia House Prices Slide as Market Downturn Spreads. A companion piece, UK Housing Market Cooling: Asking Prices Drop £100k in Richest Borough, approaches the same subject from another angle.
FAQ
What is the House Price Index?
The House Price Index is a metric used by the European Parliament to track changes in residential property prices across EU member states. It measures percentage changes from a base year, currently 2015.
Which EU country saw the largest increase in housing prices?
Hungary recorded the highest increase at 209.5% between 2015 and 2024, according to the European Parliament's data.
Why is Greece excluded from the index?
Greece is excluded due to data limitations; reliable housing price data for the entire period is not available.
Does the index account for affordability?
No, the index only measures price changes and does not consider whether people can afford the homes, nor does it differentiate between types of properties or locations.
Browse the Shop
 Acacia frida deluxe solid wood bed frame |
Bedroom bench |
Bed chest drawers |
Lingerie dresser |
Frame base |
Mirror with jewelry storage |
30 Bathroom Vanity |
Memory foam queen mattress |
Mattresses for back pain |
Nightstand set of 2 |
Grand Goldman Shop |
Civil Lawyer
Deutschland Trikot WM 2026