Warren Buffett's nickname, the Oracle of Omaha, might sound like hyperbole, but a single chart from Berkshire Hathaway's latest annual report shows it may actually be an understatement. The chart compares the cumulative return of Berkshire Hathaway stock to the S&P 500 since 1965, and the difference is staggering.
According to the data, Berkshire Hathaway has delivered a cumulative return of 6,099,294% since 1965, while the S&P 500 has returned just 46,061% over the same period. That's not a gap—it's a chasm. The visualization, created by Visual Capitalist, is so lopsided that the S&P 500 line nearly disappears without zooming in.
Find Original Home Decor sparking conversation at Grand Goldman Shop.

What the Chart Shows: Buffett vs. the S&P 500
The chart, included in Berkshire's 2025 annual letter to shareholders, plots the per-share value of Berkshire Hathaway against the S&P 500 from 1965 through today. It's a single page that encapsulates Buffett's entire investing career, and it's perhaps the most eloquent summary of what it means to invest well over a lifetime.
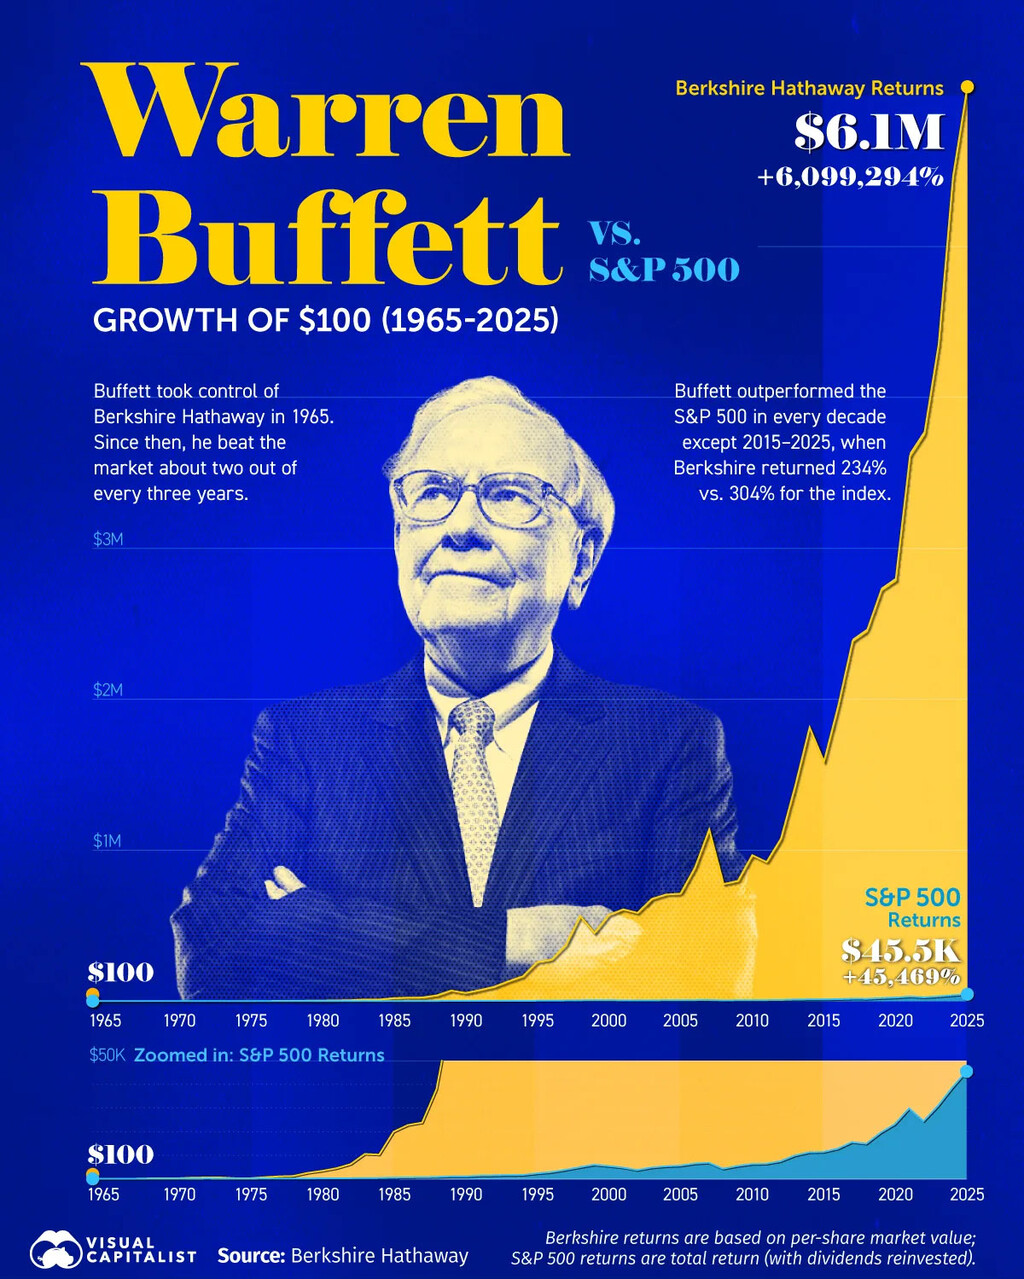
The numbers are so extreme that they almost defy belief. A $1,000 investment in Berkshire in 1965 would be worth over $61 million today, while the same amount in the S&P 500 would be worth about $461,000. That's a difference of more than 130x.
Why the S&P 500 Line Is Barely Visible
On a standard linear scale, the S&P 500's growth is dwarfed by Berkshire's exponential curve. The chart's creators had to zoom in to make the S&P 500's trajectory visible at all. This visual trick underscores just how dominant Buffett's performance has been.
It's worth noting that the S&P 500's 46,061% return is nothing to scoff at—it equates to an annualized return of about 10% over 60 years. But compared to Berkshire's 6 million percent, it's a rounding error.
Key Takeaways from Buffett's Track Record
- Long-term compounding is the most powerful force in investing—Buffett's returns are a testament to decades of consistent growth.
- Berkshire's cumulative return since 1965 is over 6 million percent, versus 46,000% for the S&P 500.
- The Oracle of Omaha has outperformed the market by a factor of more than 130.
- Annualized returns matter: Berkshire's ~20% annual return versus the S&P's ~10% adds up to an astronomical difference over time.
- Buffett's strategy of value investing and holding for the long term has proven incredibly effective.
How Berkshire Hathaway Compares to the S&P 500
The following table summarizes the performance metrics from 1965 to 2025:
| Metric | Berkshire Hathaway | S&P 500 |
|---|---|---|
| Cumulative Return (1965–2025) | 6,099,294% | 46,061% |
| Annualized Return (approx.) | ~20% | ~10% |
| Value of $1,000 Invested in 1965 | ~$61 million | ~$461,000 |
Even a casual glance at the table reveals the extraordinary scale of Buffett's success. The annualized return difference of just 10 percentage points compounds into a 130x advantage over six decades.
Why This Matters for Investors Today
Buffett's track record is more than just a bragging right—it's a case study in the power of patience and discipline. While most investors chase short-term gains, Buffett has stuck to his principles of value investing, buying wonderful companies at fair prices and holding them for the long haul.
The chart also serves as a reminder that time in the market beats timing the market. Buffett's returns weren't achieved by predicting crashes or jumping in and out of stocks; they came from owning great businesses and letting compounding work its magic.
Of course, replicating Buffett's success is easier said than done. But his annual letters and the data they contain offer valuable lessons for anyone looking to build wealth over the long term. The background to this story is set out in Warren Buffett Ends $47 Billion Gates Foundation Ties Over Epstein. A related thread runs through Warren Buffett Steps Down as Berkshire Hathaway Chair After 60 Years. Earlier coverage in S&P 500 and Nasdaq Hit Record Highs on AI Chipmaker Rally shows how the argument developed.
What to Watch Next
As Buffett approaches his mid-90s, questions about Berkshire's future without him loom large. The company has named Greg Abel as his successor, and investors will be watching closely to see if the culture of value investing persists. A closer look at the same subject appears in Business: latest articles. Anyone following the wider picture can start with DoJ Warns Elizabeth Warren to Preserve Trump Records or Face. The same theme surfaces in DOJ Warns Elizabeth Warren Over Trump Investigations: Analysis, which takes a different angle.
For now, though, the Oracle of Omaha's legacy is secure. The chart in the 2025 annual report is a fitting monument to a career that has redefined what's possible in investing. Context on how this played out before sits in Harvard's $87M Ethereum ETF Bet Lasted Just One Quarter.
FAQ
What is the Oracle of Omaha nickname?
The Oracle of Omaha is a nickname for Warren Buffett, referencing his hometown of Omaha, Nebraska, and his legendary ability to predict market trends and pick winning investments.
How much has Berkshire Hathaway returned since 1965?
Berkshire Hathaway has returned a cumulative 6,099,294% since 1965, according to the company's 2025 annual report. That's an annualized return of approximately 20%.
How does that compare to the S&P 500?
The S&P 500 has returned 46,061% over the same period, or about 10% annualized. Berkshire's return is more than 130 times larger.
Why is the S&P 500 line barely visible on the chart?
Because Berkshire's growth is so massive, the S&P 500's line appears almost flat on a linear scale. The chart's creators had to zoom in to make the S&P 500's trajectory visible.
Browse the Shop
 Acacia frida deluxe solid wood bed frame |
Bedroom bench |
Bed chest drawers |
Lingerie dresser |
Frame base |
Mirror with jewelry storage |
30 Bathroom Vanity |
Memory foam queen mattress |
Mattresses for back pain |
Nightstand set of 2 |
Grand Goldman Shop |
Civil Lawyer
Deutschland Trikot WM 2026