The global power grid is one of the most complex and essential infrastructures in the world, yet for most people it's invisible—just a flick of a switch or plugging in a cord. But behind the scenes, there's a vast conglomerate of equipment, careful planning, and evolving usage patterns (including the rise of data centers). Now, a new interactive map called OpenGridWorks is pulling back the curtain, revealing the entire electricity infrastructure of the planet in stunning detail.
What Is OpenGridWorks?
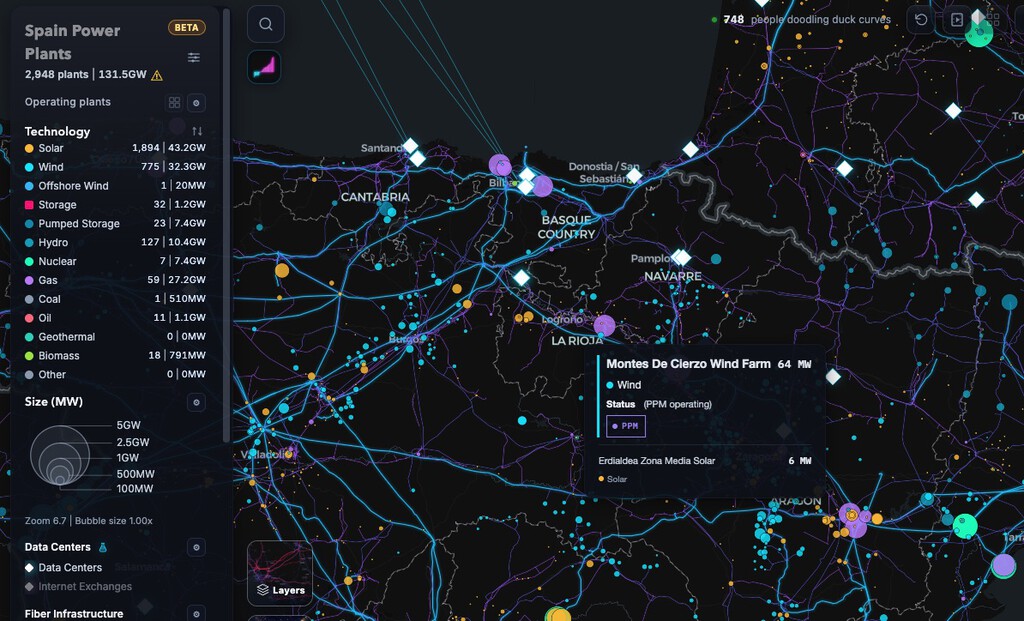
OpenGridWorks is a web-based platform for geospatial visualization of electricity infrastructure. It uses data from OpenStreetMap, the collaborative mapping project, to display everything from small solar plants to massive transmission lines that cross continents. The map is not only visually striking with its beautiful color compositions but also practically useful for engineering project planning and energy policy analysis.
Find Original Home Decor sparking conversation at Grand Goldman Shop.

Why the Global Power Grid Map Matters
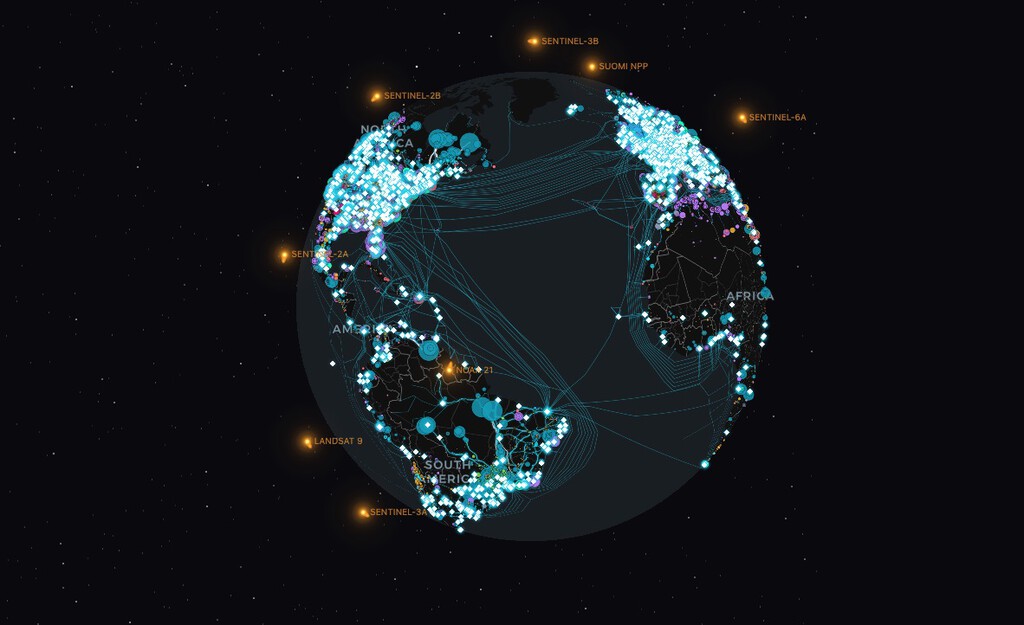
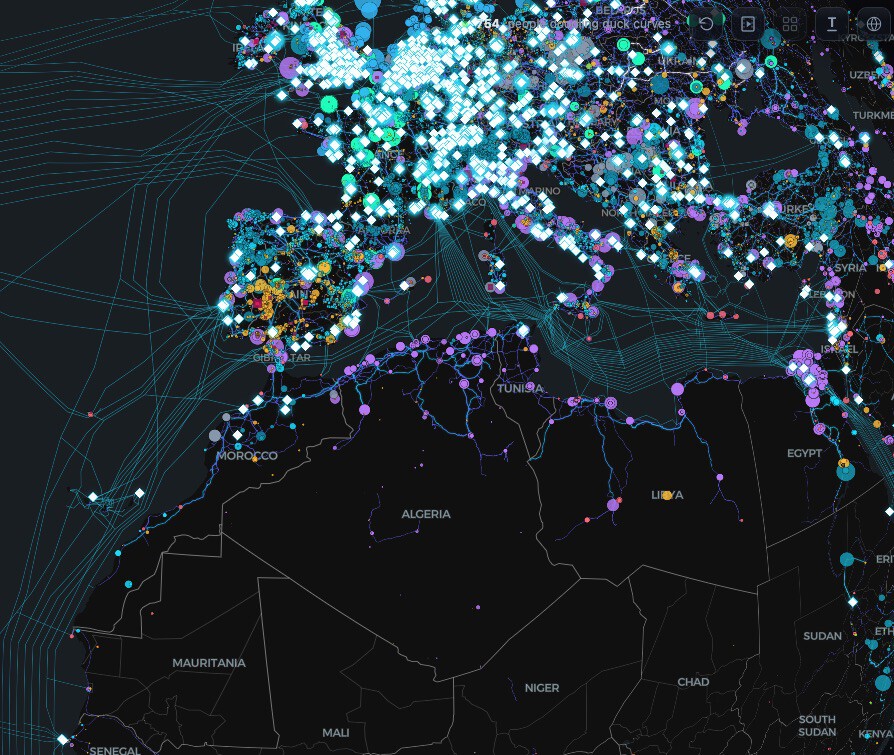
This map highlights the uneven density of electrical grids around the world. Some regions are densely interconnected, while others have significant gaps—true "black holes" in the global grid. As the energy transition accelerates, with renewable sources replacing traditional ones, understanding these disparities becomes crucial. The map also reflects changing usage patterns, such as the growing demand from data centers. The background to this story is set out in Iberian Rivers Swing from Drought to Deluge: Interactive Map Shows 38x Flow. A related thread runs through Interactive Eclipse Map Reveals Stories From Cultures Worldwide. Earlier coverage in Interactive Map Shows All 140 Spanish Lighthouses in Real Time shows how the argument developed.
Key Features and Applications
- Comprehensive coverage: Displays all types of electricity infrastructure, from small-scale solar to cross-continental lines.
- Open data source: Built entirely on OpenStreetMap data, ensuring transparency and community-driven updates.
- Interactive visualization: Users can zoom in and explore specific regions, making it a valuable tool for researchers and policymakers.
- Practical applications: Useful for planning engineering projects, analyzing energy policy, and identifying infrastructure gaps.
- Visual appeal: The map's aesthetic color schemes make complex data accessible and engaging.
How the Map Compares to Other Tools
While there are other energy mapping tools, OpenGridWorks stands out for its global scope and reliance on open data. Here's a quick comparison: A closer look at the same subject appears in Energy Utilities: latest articles. Anyone following the wider picture can start with Spain's Record Power Grid Investment Plan Through 2030. The same theme surfaces in Spain's Blackout Recovery: One Year of Power Grid Upgrades, which takes a different angle.
| Feature | OpenGridWorks | Other Tools |
|---|---|---|
| Data Source | OpenStreetMap | Proprietary or limited open data |
| Coverage | Global | Often regional or national |
| Interactivity | Highly interactive | Varies, often static |
| Cost | Free and open | Often subscription-based |
What to Watch Next
As the energy transition continues, tools like OpenGridWorks will become increasingly important for understanding and planning our electricity future. Keep an eye on how this map evolves with new data and how it influences energy policy decisions worldwide. The gaps in the grid also highlight opportunities for investment and development, particularly in renewable energy integration. Context on how this played out before sits in La Palma Blackout: Entire Island Loses Power in Total Outage. A companion piece, Interactive Map Reveals the Entire Global Power Grid, approaches the same subject from another angle.
FAQ
What is OpenGridWorks?
What is OpenGridWorks?
OpenGridWorks is an interactive web platform that visualizes global electricity infrastructure using data from OpenStreetMap. It shows everything from small solar plants to major transmission lines.
Why is this map important?
It highlights disparities in grid density and supports energy planning and policy analysis, especially as renewable energy sources expand.
Who can use OpenGridWorks?
Engineers, policymakers, researchers, and anyone interested in energy infrastructure can use it for free.
What are the gaps in the global power grid?
Some regions lack sufficient grid infrastructure, creating "black holes" that can hinder economic development and renewable energy integration.
Browse the Shop
 Acacia frida deluxe solid wood bed frame |
Bedroom bench |
Bed chest drawers |
Lingerie dresser |
Frame base |
Mirror with jewelry storage |
30 Bathroom Vanity |
Memory foam queen mattress |
Mattresses for back pain |
Nightstand set of 2 |
Grand Goldman Shop |
Civil Lawyer
Deutschland Trikot WM 2026