What share of your salary goes to rent in Europe? New maps from the European Observation Network for Territorial Development and Cohesion (ESPON) answer that question with unprecedented detail, and the results put Spain in a harsh light. The data, part of the House for All project led by TU Wien and funded by the EU, shows that rent affordability varies dramatically depending on where you live and the size of the home.
Until recently, comparing rental costs across Europe was impossible due to a lack of harmonized data. The project fills that gap by tracking real estate portals weekly across the continent between March 2024 and March 2025, collecting 22 million valid listings. From there, researchers calculated average rents per municipality and compared them with average incomes from Eurostat.
Find Original, High-end Home Decor that spark conversation at Grand Goldman Shop.
Why Rent Affordability Is a Hot Topic Across Europe
Housing has become a political potato for citizens and governments alike. Prices have skyrocketed in recent years, but the drama, though widespread, varies by neighborhood: renting in Madrid is not the same as renting in Vienna, and buying in Madrid is not the same as buying in Soria.
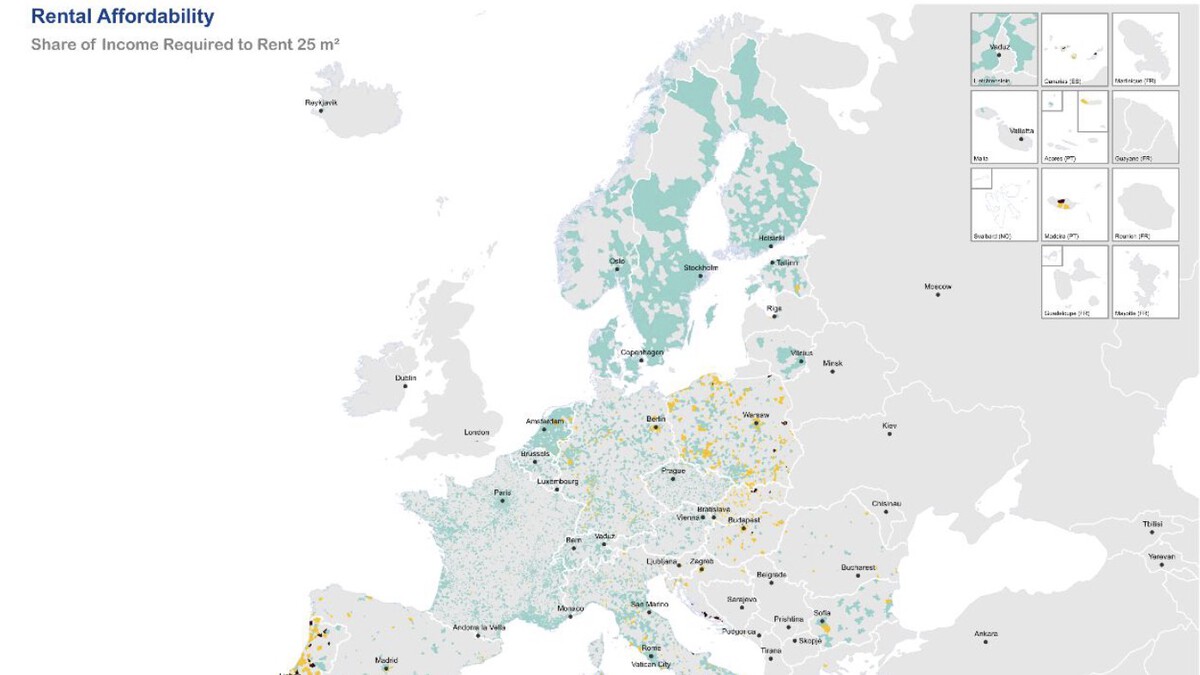
The new maps make these differences visible. They show the percentage of net income a household must dedicate to rent, broken down by apartment size. The color coding ranges from affordable (green) to severely burdened (red), offering a clear picture of where tenants are struggling most.
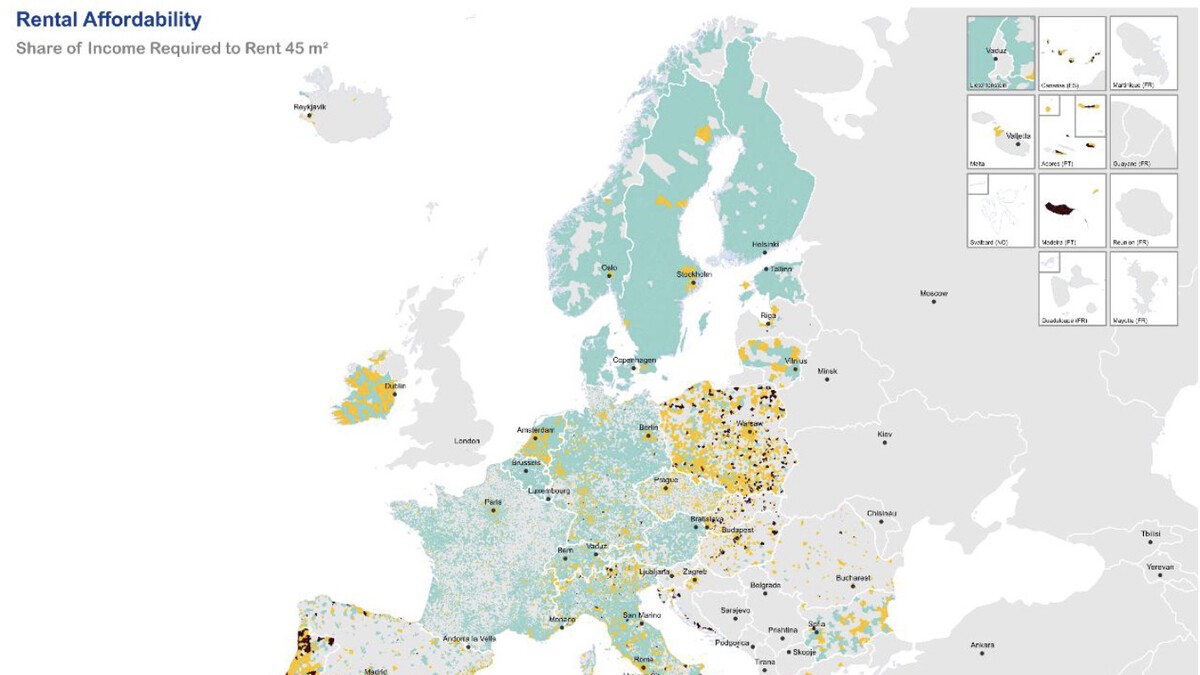
How the Three Maps Work
The project produced three maps, each for a different apartment size: small (one bedroom or less), medium (two to three bedrooms), and large (four or more bedrooms). This distinction matters because larger homes naturally consume a bigger share of income, but the disparity across regions is striking.
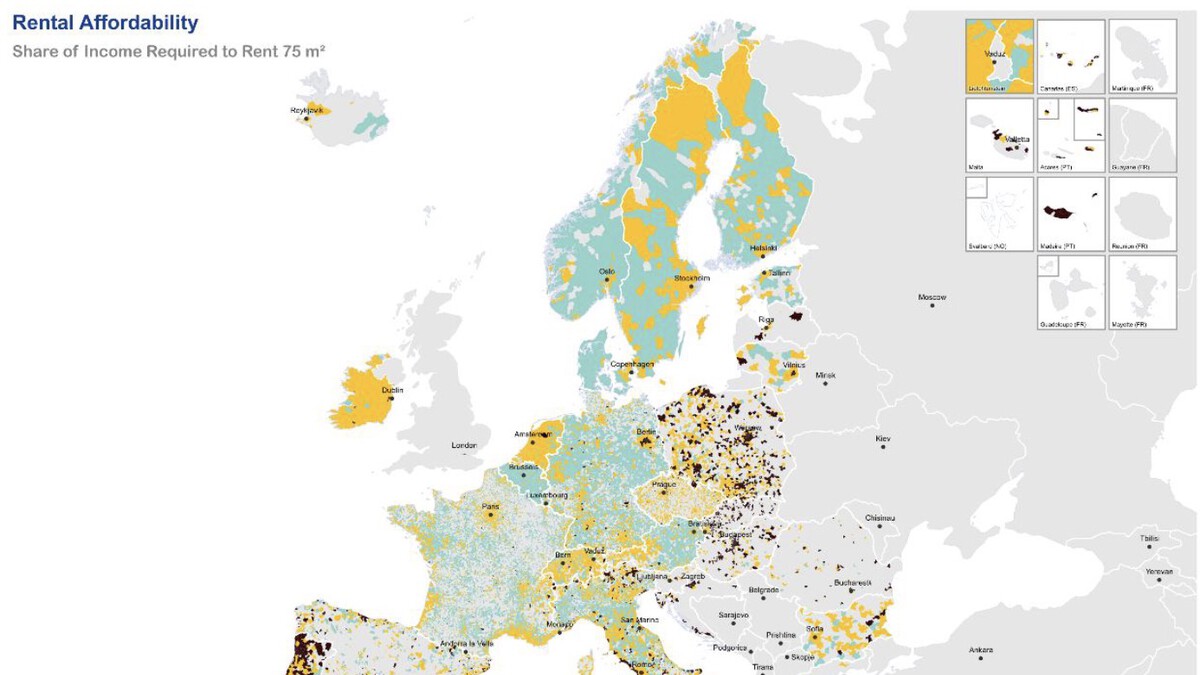
For each municipality, the researchers calculated the average rent from listings and divided it by the average net income. The result is a percentage that reveals the effort required to secure housing. In some cities, rent eats up more than half of a typical salary; in others, it remains below 20%.
Key Findings: Spain Stands Out
Spain, particularly its major urban areas, appears among the most stressed regions on the maps. In cities like Madrid, Barcelona, and Valencia, the share of salary needed for rent has reached levels that many consider unsustainable. The maps show that even a small apartment can consume over 40% of an average income in these hotspots.
This aligns with the ongoing housing protests in Spain, where citizens have taken to the streets demanding affordable housing. The data confirms that the problem is not just anecdotal but structural, with rental prices outpacing wage growth for years.
- Spain's urban centers show some of the highest rent-to-income ratios in Europe, especially for medium-sized apartments.
- Variation within countries is huge: rural areas in Spain remain relatively affordable compared to Madrid or Barcelona.
- Northern European cities like Vienna and Berlin often show lower percentages due to stronger rent controls and higher average incomes.
- Small apartments are generally more affordable, but in top-tier cities even studios can demand over 30% of a salary.
- Data coverage includes 22 million listings, providing a robust snapshot of the rental market across the EU.
What the Maps Reveal About Europe's Rental Divide
The maps highlight a clear east-west and north-south divide. In many Eastern European countries, rents remain low relative to incomes, though quality and availability may vary. In contrast, popular Western European cities face severe affordability crises.
For Spain, the maps serve as a wake-up call. The country's tourism-driven economy and limited social housing have contributed to the squeeze. The House for All project aims to inform policy by providing comparable data, but the immediate takeaway is that tenants in Spain's biggest cities are dedicating an extraordinary share of their paychecks to keep a roof over their heads. The background to this story is set out in Why People Are Protesting Across Europe: Schools, Housing, Costs. A related thread runs through Indefinite Rental Contracts: Europe's Solution to Housing Crises. Earlier coverage in Husband Wants A Share In Wife’s Salary Because She’s Working From His Home shows how the argument developed.
What to Watch Next
The project's findings will likely fuel debates on rent regulation and housing policy across the EU. As the data becomes more widely available, expect governments to face pressure to act. For renters, the maps offer a tool to understand whether their situation is typical or extreme. A closer look at the same subject appears in Solar Eclipse Across Europe: Share Your Photos and Experiences. Anyone following the wider picture can start with Apprenticeship Experience: UK Employers Share Insights. The same theme surfaces in Dining Across the Divide: Political Rivals Share a Meal, which takes a different angle.
Spain's new housing minister has promised measures, but the maps show the scale of the challenge. With rents continuing to rise, the share of salary going to housing may keep growing unless supply increases or incomes rise. Context on how this played out before sits in Tesla CEO Pay Gap: Musk Earns 2.5M Times Worker Salary. A companion piece, UK CEO Pay Gap Widens to Record 130x Average Worker Salary, approaches the same subject from another angle.
FAQ
What do the three maps show?
The maps display the percentage of average net income required to rent an apartment in municipalities across Europe, categorized by apartment size (small, medium, large). They use color to indicate affordability, from green (low effort) to red (high effort).
How was the data collected?
Researchers tracked real estate portals weekly from March 2024 to March 2025, gathering 22 million valid rental listings. They then calculated average rents per municipality and compared them with income data from Eurostat.
Why does Spain stand out in these maps?
Spain's major cities like Madrid and Barcelona show some of the highest rent-to-income ratios in Europe. In these areas, renting even a small apartment can consume over 40% of an average salary, reflecting a severe affordability crisis.
What is the House for All project?
House for All is an EU-funded project led by TU Wien that aims to provide comparable data on housing affordability across Europe. It uses real estate listings and income data to create maps and reports that inform policy debates.
Browse the Shop
 Acacia frida deluxe solid wood bed frame |
Bedroom bench |
Bed chest drawers |
Lingerie dresser |
Frame base |
Mirror with jewelry storage |
30 Bathroom Vanity |
Memory foam queen mattress |
Mattresses for back pain |
Nightstand set of 2 |
Grand Goldman Shop |
Civil Lawyer
Deutschland Trikot WM 2026