5,000 years of human civilization are now condensed into a single, striking chart that reveals which empires rose, fell, and endured. The Timeline of World History by ChartOrigin spans from 3000 BC to 2000 AD, offering a comparative visual chromogram organized by region. This infographic goes beyond John B. Sparks' famous 1931 Histogram, adding an extra thousand years of history and a clearer regional breakdown.
The chart's goal is simple yet ambitious: let you see at a glance which empires coexisted at any moment. By dividing history into eras—Bronze Age, Iron Age, Classical Antiquity, Middle Ages, and Modern Era—it transforms thousands of years of complex history into an accessible visual narrative.
Find Original Home Decor sparking conversation at Grand Goldman Shop.

What the 5,000-Year Civilization Chart Reveals
The chart is organized into vertical columns, each representing a region or country. Horizontal bands of color differentiate empires, dynasties, and kingdoms. The vertical axis tracks time, with older periods at the top and more recent ones at the bottom. A quick glance tells you which power dominated a territory at any given time.
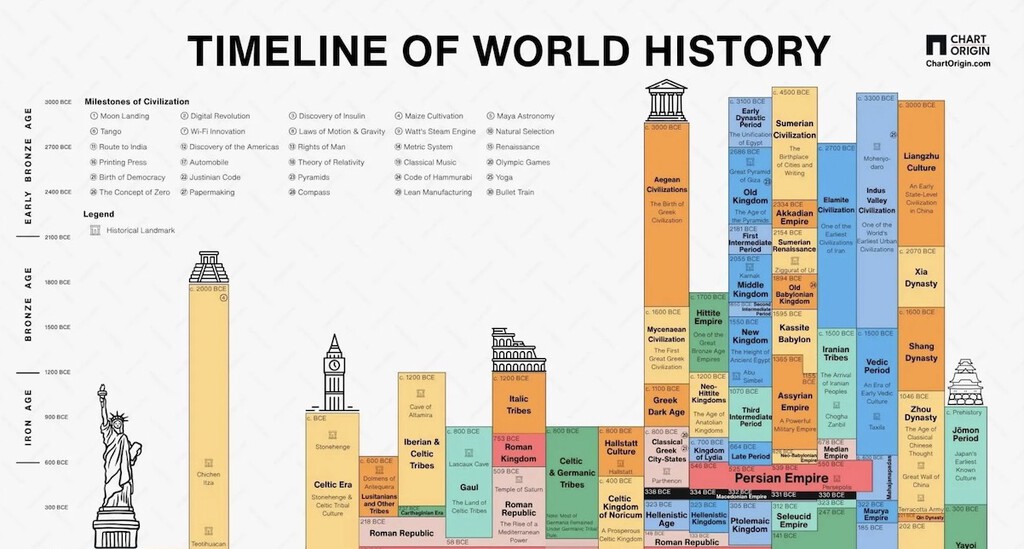
This layout highlights patterns that are hard to grasp from traditional text-based history. For instance, you can instantly see how the Roman Empire overlapped with the Han Dynasty in China, or how the Byzantine Empire persisted long after the Western Roman Empire fell.
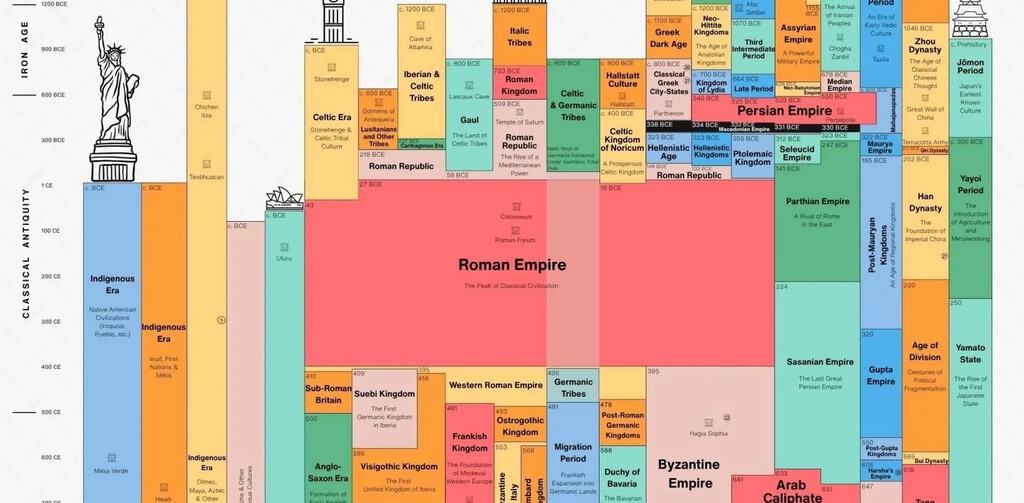
How to Read the Visual Timeline
Start by locating a region of interest on the horizontal axis. Then follow the vertical timeline downward to see the succession of powers. Each color block represents a distinct empire or ruling dynasty. The width of each column shows the geographic extent of that region's influence at different times.
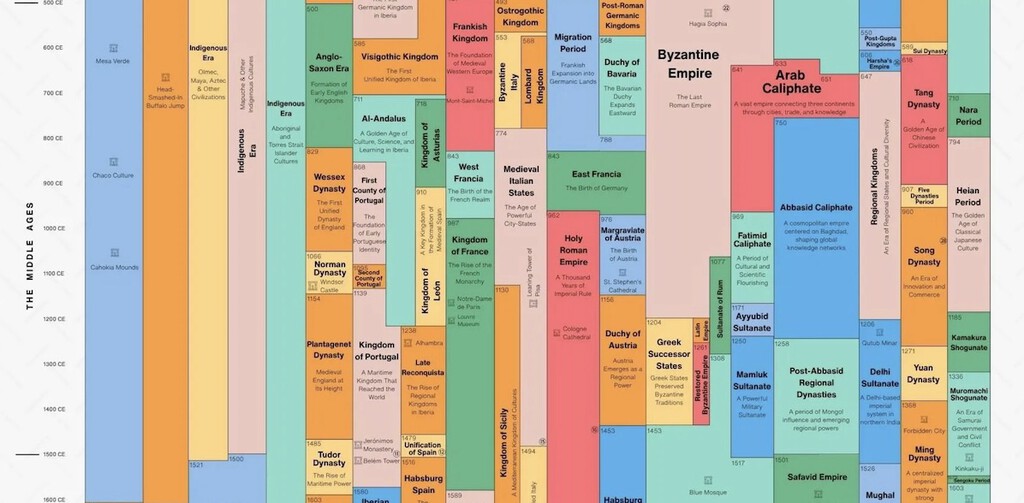
The chart also includes labels for major events and periods, helping viewers connect the visual blocks to historical milestones. Whether you're a history buff or a curious learner, this tool offers a unique perspective on the sweep of human civilization.
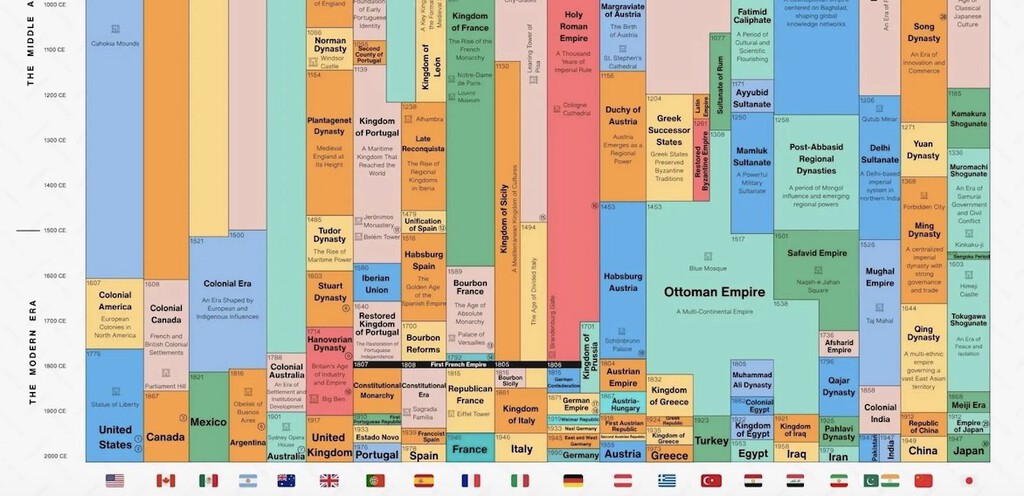
Why Some Countries Appear Eternal
One of the most striking takeaways from the chart is the persistence of certain regions as continuous political entities. While empires rise and fall, some countries—like China, Iran, and Egypt—show remarkable continuity in their civilizational identity. Their columns are filled with overlapping dynasties and regimes, but the geographic and cultural core remains recognizable across millennia.
This visual representation challenges the notion that nations are fleeting. Instead, it suggests that some societies possess a resilience that transcends individual rulers or governments. The chart doesn't explicitly label these as 'eternal,' but the pattern is unmistakable.
Comparing Empire Longevity
The chart allows for direct comparison of empire durations. For example, you can see that the ancient Egyptian civilization lasted for over 3,000 years, while the Macedonian Empire of Alexander the Great was a brief flash. Such contrasts underscore the varied pace of historical change.
By presenting these timelines side by side, the infographic invites viewers to ponder why some empires endured while others collapsed quickly. Factors like geography, governance, and cultural cohesion come into play, though the chart itself doesn't provide explanations.
Key Takeaways from the Timeline
- The chart covers 5,000 years, from 3000 BC to 2000 AD, across multiple regions.
- It uses color-coded blocks to represent empires, dynasties, and kingdoms.
- Vertical axis shows time progression; horizontal axis shows regions.
- Some regions exhibit remarkable continuity, appearing almost eternal.
- The visual format makes complex historical overlaps easy to grasp.
How the Chart Compares to Other Historical Timelines
Unlike traditional timelines that focus on a single region or empire, this chart offers a global comparative view. It builds on the legacy of John B. Sparks' Histogram, which covered 4,000 years but lacked the regional granularity of this new version. The addition of the Bronze Age and Iron Age provides deeper context for the rise of classical civilizations.
The chart is also a commercial product—a poster available for purchase—but its educational value is undeniable. It serves as a conversation starter and a learning tool for classrooms, history enthusiasts, and anyone fascinated by the grand sweep of human history. The background to this story is set out in Andy Burnham Cabinet: Gender, Race, and Region in Charts. A related thread runs through Trending: latest articles. Earlier coverage in Catholic Monarchs' State Brothel Network in Granada shows how the argument developed.
| Era | Time Period | Key Civilizations |
|---|---|---|
| Bronze Age | 3000–1200 BC | Egypt, Mesopotamia, Indus Valley |
| Iron Age | 1200–500 BC | Assyria, Zhou Dynasty, Olmec |
| Classical Antiquity | 500 BC–500 AD | Rome, Greece, Han Dynasty |
| Middle Ages | 500–1500 AD | Byzantium, Islamic Caliphates, Tang Dynasty |
| Modern Era | 1500–2000 AD | European Colonial Empires, Ming/Qing, Mughal |
What This Means for Our Understanding of History
This chart reminds us that history is not a linear story of progress but a complex tapestry of overlapping civilizations. It challenges Eurocentric views by giving equal visual weight to Asian, African, and American empires. For educators, it's a powerful tool to show students that multiple advanced societies existed simultaneously across the globe. A closer look at the same subject appears in SS Yongala: The 1911 Shipwreck That Became a Thriving Reef. Anyone following the wider picture can start with Spanish Collector's Home Overflows with Unique Memories. The same theme surfaces in Four Humors Theory: Why Ancient Medicine Sometimes Worked, which takes a different angle.
Moreover, the chart's emphasis on continuity versus change invites reflection on our own era. Which of today's powers will appear as brief blips on a future version of this timeline? And which will endure for millennia? Such questions are speculative, but the chart provides a framework for thinking about them. Context on how this played out before sits in First Nonstop Transatlantic Flight: The 1919 Vickers Vimy. A companion piece, 5,000 Years of Human Civilization in One Chart: Eternal Empires, approaches the same subject from another angle.
FAQ
What is the Timeline of World History chart?
It's a visual infographic by ChartOrigin that maps 5,000 years of human civilization across different regions, using color-coded blocks to show empires and dynasties from 3000 BC to 2000 AD.
How do I read the chart?
The vertical axis represents time, with older periods at the top. The horizontal axis shows regions. Each color block indicates which empire or dynasty controlled that region at a given time.
Why does the chart show some countries as 'eternal'?
Certain regions like China, Iran, and Egypt display continuous civilizational identity despite changes in ruling dynasties, giving the impression of eternal nations.
Is the chart available for purchase?
Yes, it's a commercial poster, but the visual information itself is a valuable educational resource for history enthusiasts and students.
Browse the Shop
 Acacia frida deluxe solid wood bed frame |
Bedroom bench |
Bed chest drawers |
Lingerie dresser |
Frame base |
Mirror with jewelry storage |
30 Bathroom Vanity |
Memory foam queen mattress |
Mattresses for back pain |
Nightstand set of 2 |
Grand Goldman Shop |
Civil Lawyer
Deutschland Trikot WM 2026