An interactive map called Climate Visualized reveals the exact climate twin of your city, showing where in the world you can find the same weather patterns. Created by Atlas Guo, a cartographer at the University of Wisconsin-Madison, the tool uses the Köppen-Geiger climate classification to match locations with identical climates. The result is surprising: for example, Seville in Spain has the same climate as parts of Zambia and northern India.
This map is more than a curiosity—it's a powerful way to understand climate change and its global impact. By exploring climate twins, you can see how climate change is shifting weather patterns and what the future might hold for your region.
Find Original Home Decor sparking conversation at Grand Goldman Shop.

What Is the Climate Twin Map?
The Climate Visualized map is an interactive tool that lets you explore climate patterns anywhere on Earth. It uses the Köppen-Geiger classification system, the most widely used method for classifying climates. This system categorizes climates based on temperature and precipitation patterns, resulting in five main groups: tropical, dry, temperate, continental, and polar.
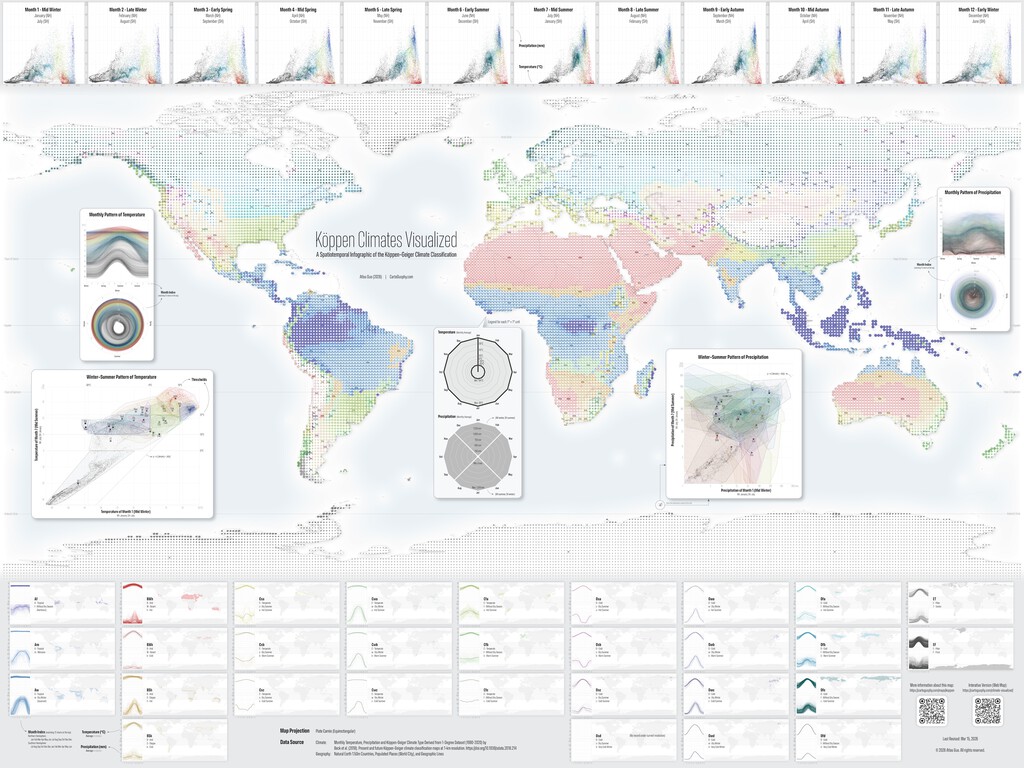
Guo built the map using D3.js, a powerful visualization library, and data from a 2018 study by Beck et al., which produced the most detailed global climate map to date. The map covers the period 1990-2020 at a resolution of 1 degree latitude by 1 degree longitude. By making this data interactive, Guo allows anyone to explore climate patterns and find climate twins for any location.
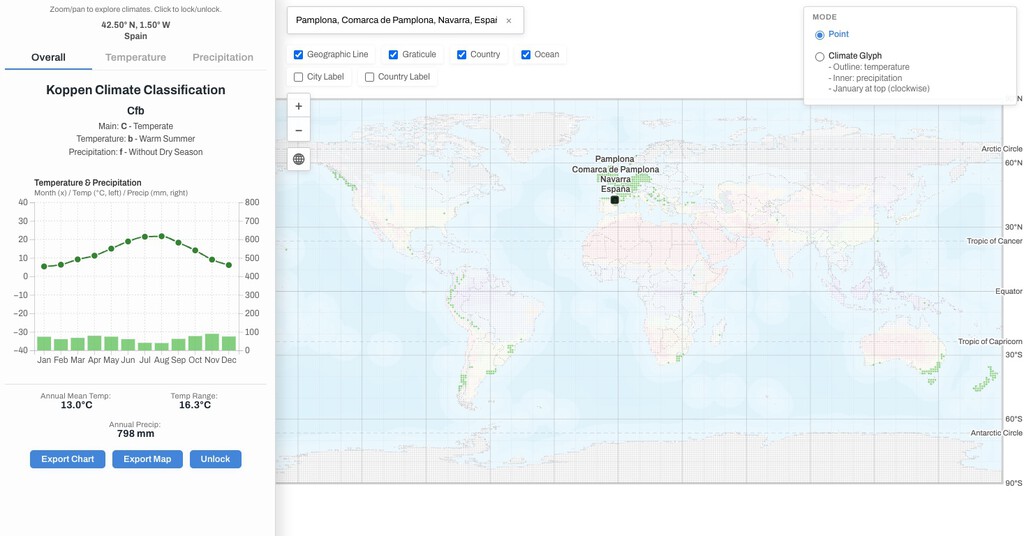
How to Find Your City's Climate Twin
Using the map is straightforward: simply click on any location, and the map highlights all other areas with the same climate classification. You can also search for a specific city to see its climate twin. The map displays the Köppen-Geiger classification for each location, so you can compare climates directly.
For instance, Seville's climate is classified as Csa (hot-summer Mediterranean climate), which is also found in parts of Zambia and northern India. This means that despite being on different continents, these regions experience similar temperature and precipitation patterns.
Why Climate Twins Matter
Understanding climate twins has practical implications. For travelers, it can help identify destinations with familiar weather. For farmers, it can inform crop selection by comparing climates. For urban planners, it can provide insights into how other cities manage similar climate challenges.
More importantly, climate twins highlight the interconnectedness of our climate. As climate change alters weather patterns, some regions may become more like others. This can help scientists and policymakers anticipate changes and develop adaptation strategies. Context on how this played out before sits in Interactive Map Reveals Your City's Exact Climate Twin.
The Science Behind the Map
The Köppen-Geiger classification is based on monthly temperature and precipitation data. It divides climates into five main groups, which are further subdivided into subtypes. For example, the tropical group includes rainforest, monsoon, and savanna climates. The dry group includes desert and steppe climates. The background to this story is set out in Iberian Rivers Swing from Drought to Deluge: Interactive Map Shows 38x Flow. A related thread runs through Interactive Map Shows All 140 Spanish Lighthouses in Real Time.
The Beck et al. (2018) study used high-resolution data to create a global climate map. Guo's map uses a lower resolution version (1 degree) to make it interactive and accessible. Despite the lower resolution, the map still provides accurate climate classifications for most locations. Earlier coverage in Interactive Eclipse Map Reveals Stories From Cultures Worldwide shows how the argument developed. A closer look at the same subject appears in Energy Utilities: latest articles.
Key Takeaways
- Climate Visualized is an interactive map that shows climate twins based on the Köppen-Geiger classification.
- It uses data from 1990-2020 and was created by Atlas Guo at the University of Wisconsin-Madison.
- Seville's climate twin includes parts of Zambia and northern India.
- The map helps understand climate change impacts and can inform travel, agriculture, and urban planning.
- The tool is built with D3.js and based on a 2018 study by Beck et al.
Climate Classification Comparison
| City | Köppen-Geiger Classification | Climate Twin Examples |
|---|---|---|
| Seville, Spain | Csa (Hot-summer Mediterranean) | Parts of Zambia, Northern India |
| London, UK | Cfb (Temperate oceanic) | Parts of New Zealand, Pacific Northwest |
| Miami, USA | Am (Tropical monsoon) | Parts of Southeast Asia, Northern Australia |
| Cairo, Egypt | BWh (Hot desert) | Parts of Arizona, Saudi Arabia |
This table shows examples of climate twins for selected cities. The Köppen-Geiger classification helps identify regions with similar climates, which can be useful for various applications. Anyone following the wider picture can start with Europe's 2025 Heatwave Outpaces 2050 TV Forecast. The same theme surfaces in Spain's Climate Shift: From 'Spanishizing' Europe to 'Saharizing' Itself, which takes a different angle.
FAQ
What is a climate twin?
A climate twin is another location on Earth that shares the same climate classification as your city. This means it experiences similar temperature and precipitation patterns throughout the year.
How accurate is the Climate Visualized map?
The map uses data from a peer-reviewed study and the Köppen-Geiger classification, which is widely accepted. While the resolution is 1 degree, it provides reliable climate classifications for most regions.
Can I use this map to plan a trip?
Yes, you can use it to find destinations with weather similar to what you're used to. However, keep in mind that local microclimates and seasonal variations may exist.
How does climate change affect climate twins?
As climate change shifts weather patterns, some regions may develop new climate twins. This map is based on historical data (1990-2020), so future changes are not reflected.
Exploring climate twins is a fascinating way to understand our planet's climate diversity. Whether you're a traveler, researcher, or simply curious, the Climate Visualized map offers valuable insights into the world's climates.
Browse the Shop
 Acacia frida deluxe solid wood bed frame |
Bedroom bench |
Bed chest drawers |
Lingerie dresser |
Frame base |
Mirror with jewelry storage |
30 Bathroom Vanity |
Memory foam queen mattress |
Mattresses for back pain |
Nightstand set of 2 |
Grand Goldman Shop |
Civil Lawyer
Deutschland Trikot WM 2026