The Chernobyl nuclear disaster maps, compiled in the Atlas of the Chernobyl Exclusion Zone, reveal the true scale of radioactive contamination 40 years after the 1986 explosion. These cartographic resources show how far radiation spread and its impact on the environment.
On April 26, 1986, reactor number 4 at the Chernobyl nuclear power plant in the Ukrainian Soviet Socialist Republic exploded during a low-power safety test. The accident released an estimated 400 times more radioactive material than the atomic bomb dropped on Hiroshima, according to the International Atomic Energy Agency.
Find Original Home Decor sparking conversation at Grand Goldman Shop.

The RBMK-1000 reactor lacked a containment structure, so radioisotopes such as iodine-131, cesium-137, and strontium-90 dispersed freely into the atmosphere for ten consecutive days until the graphite fire was extinguished on May 5. The accident management was poor: authorities ordered the evacuation of the nearby city of Pripyat 36 hours later, and the world learned of the disaster when Sweden detected radiation at its Forsmark plant on April 28.
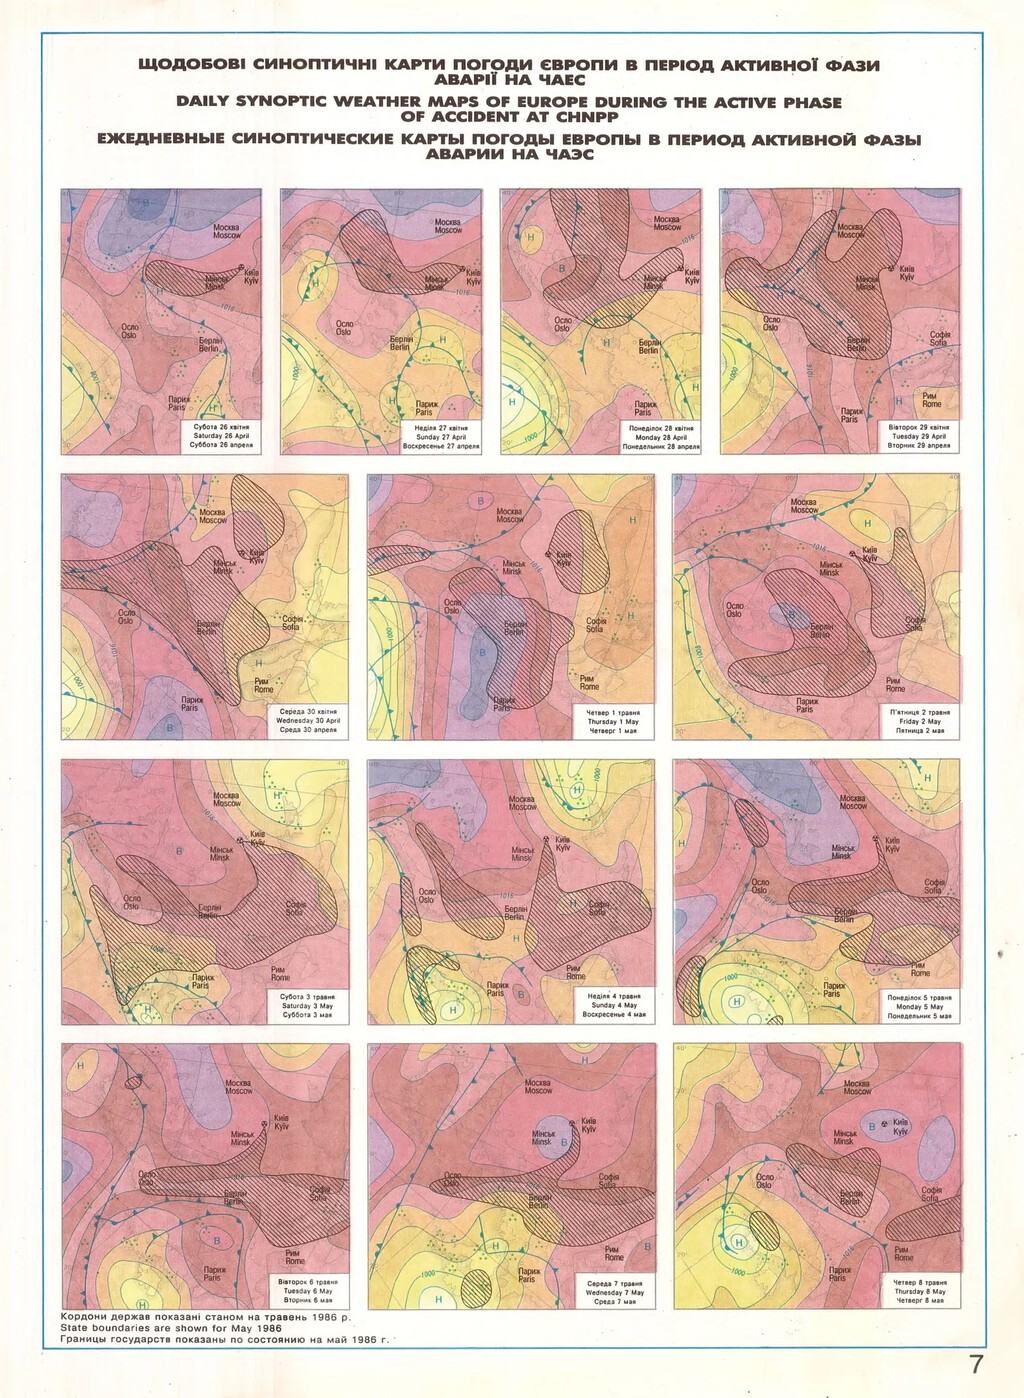
What the Chernobyl Maps Reveal About the Disaster
Ten years later, independent Ukraine published the Atlas of the Chernobyl Exclusion Zone, a set of large-format graphic resources produced by the state cartographic agency. As data journalist Attila Bátorfy explains, it was the first serious attempt to map the radioactive impact of the disaster on soil, air, and ecosystems. Numerous professionals from scientific entities such as the Academy of Sciences of Ukraine and other research institutes participated in its creation.
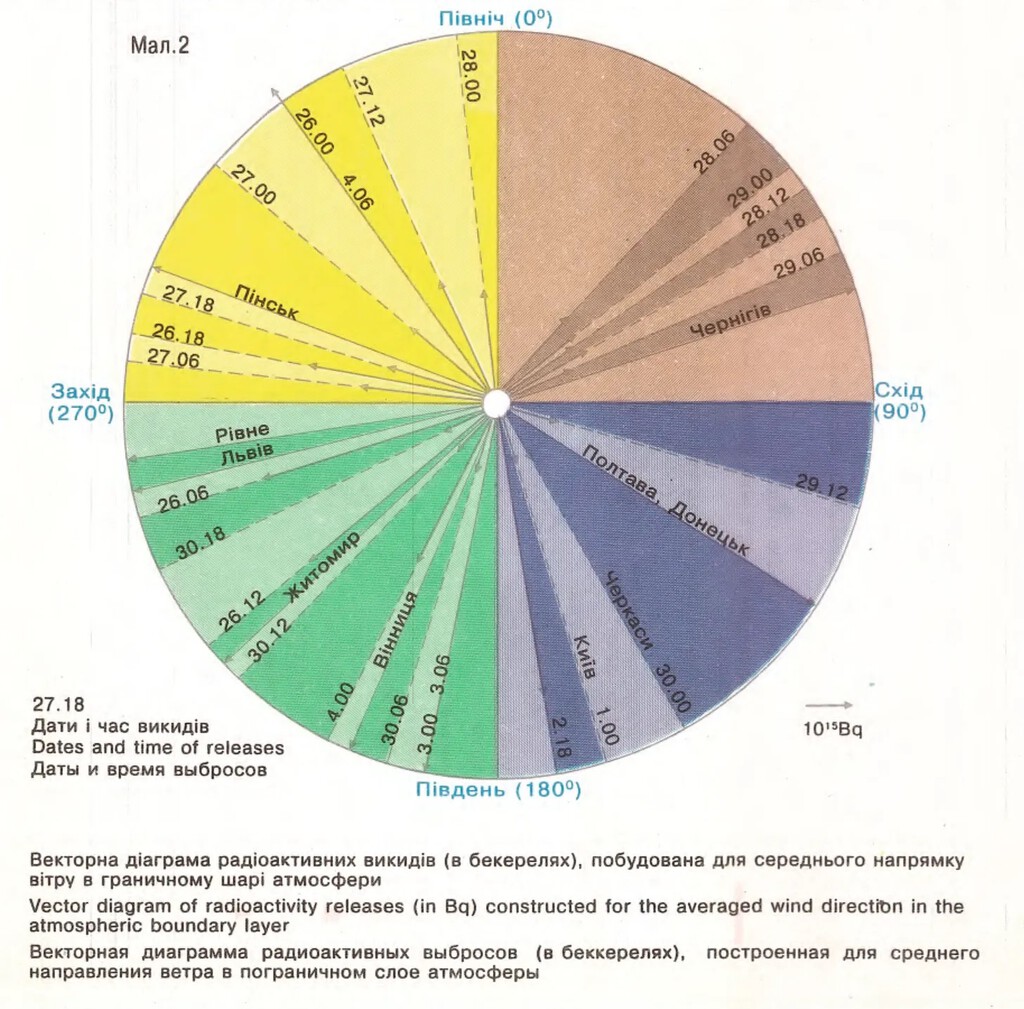
The maps provide a detailed view of how radioactive fallout settled across the region. They show contamination levels of cesium-137, strontium-90, and other isotopes in different areas, helping scientists and policymakers understand the extent of the damage.
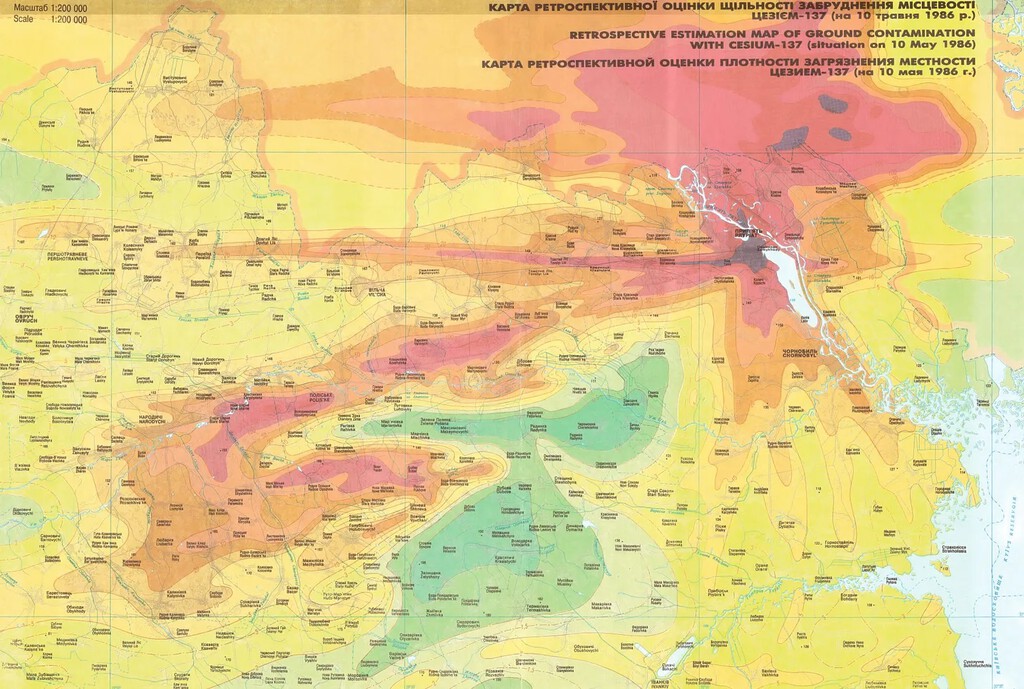
These visualizations also highlight the challenges of managing a nuclear disaster. The maps reveal that radioactive particles spread far beyond the immediate vicinity of the plant, affecting large areas of Ukraine, Belarus, and Russia.
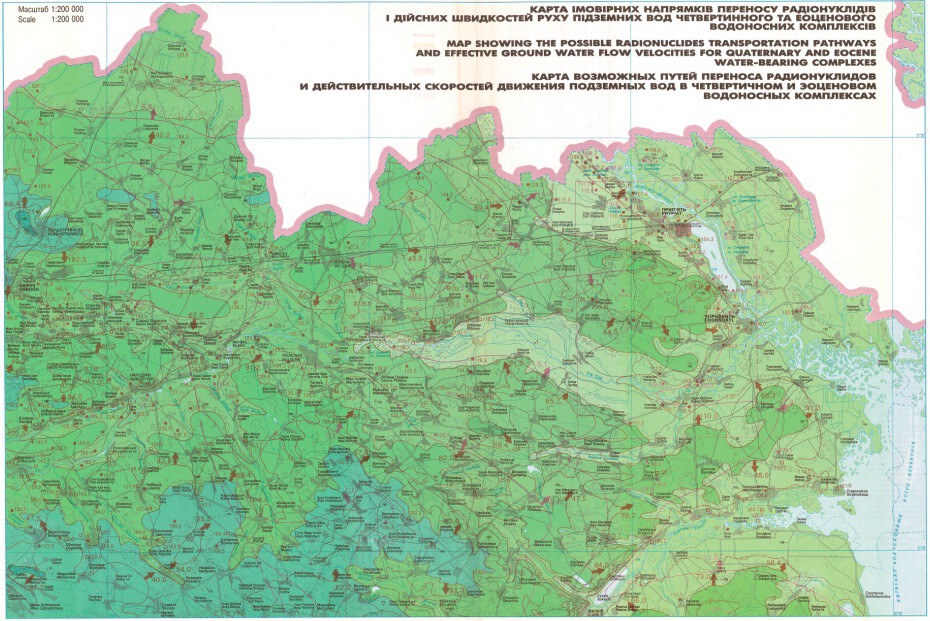
Why the Chernobyl Maps Matter Today
The Chernobyl maps are not just historical documents; they are crucial tools for ongoing research and safety planning. They help experts assess the long-term health and environmental impacts of radiation exposure.
Moreover, the maps serve as a reminder of the importance of transparency and accurate information during nuclear emergencies. The Soviet authorities initially tried to cover up the scale of the disaster, delaying evacuations and withholding critical data.
Today, the exclusion zone around Chernobyl remains one of the most radioactive places on Earth. The maps help define its boundaries and monitor changes over time.
Key Takeaways from the Chernobyl Mapping Effort
- The Atlas of the Chernobyl Exclusion Zone was the first comprehensive attempt to map radioactive contamination after the disaster.
- It involved collaboration among multiple scientific institutions and cartographic experts.
- The maps reveal the widespread dispersion of radioisotopes like cesium-137 and strontium-90.
- They underscore the lack of containment and delayed evacuation that worsened the crisis.
- Such maps are essential for long-term environmental monitoring and emergency preparedness.
Comparing Chernobyl to Other Nuclear Incidents
The Chernobyl disaster remains the worst nuclear accident in history, but comparing it to other incidents highlights the role of reactor design and safety protocols. The table below summarizes key differences.
| Incident | Year | Reactor Type | Containment | INES Rating | Radioactive Release |
|---|---|---|---|---|---|
| Chernobyl | 1986 | RBMK-1000 | None | 7 | ~400 times Hiroshima |
| Fukushima Daiichi | 2011 | BWR | Yes (but failed) | 7 | ~10% of Chernobyl |
| Three Mile Island | 1979 | PWR | Yes | 5 | Minimal |
The comparison shows that containment structures and emergency response are critical in mitigating the consequences of nuclear accidents.
What to Watch Next in Chernobyl Research
Scientists continue to study the exclusion zone to understand radiation's effects on ecosystems. Recent research focuses on wildlife adaptation and the spread of radioactive particles through water and soil.
New mapping technologies, including drones and satellite imagery, are being used to create more precise contamination maps. These tools can help identify hotspots and track changes over time.
For those interested in energy innovations, China's 582-Ton Magnet for Artificial Sun Fusion Energy represents a step toward safer nuclear fusion. The project aims to replicate the sun's energy production with minimal radioactive waste. The background to this story is set out in Chernobyl's New Hole: The Men Who Fought a Drone Fire. A related thread runs through Russian Drone Strikes Chernobyl Nuclear Waste Facility. Earlier coverage in Chernobyl's Steel Shield Damaged: $500 Million Repair Needed shows how the argument developed.
Understanding past disasters is crucial for improving nuclear safety. The lessons from Chernobyl have led to stricter international safety standards and better reactor designs. A closer look at the same subject appears in Why Chernobyl Wild Boars Are So Radioactive: The Real Cause. Anyone following the wider picture can start with UN Votes on Accurate World Map Showing Africa's True Scale. The same theme surfaces in Meta Data Center Water Contamination: Bacteria Found in Wyoming, which takes a different angle.
As we look to the future, accurate mapping and transparent communication will remain essential for managing nuclear risks. The Chernobyl maps stand as a testament to the power of cartography in revealing hidden dangers. Context on how this played out before sits in Norway Town's Tap Water Contaminated by Thawing Permafrost. A companion piece, Russian Drone Hits Spent Nuclear Fuel Building Near Chernobyl, approaches the same subject from another angle.
FAQ
What was the Chernobyl nuclear disaster?
The Chernobyl nuclear disaster was a catastrophic nuclear accident that occurred on April 26, 1986, at the Chernobyl Nuclear Power Plant in Ukraine. An explosion and fire released large quantities of radioactive particles into the atmosphere, spreading across Europe.
Why are the Chernobyl maps important?
The maps provide a detailed visual representation of radioactive contamination, helping scientists and authorities understand the scale of the disaster and plan for long-term environmental monitoring and safety measures.
How did the Chernobyl maps come about?
They were published in 1996 by the Ukrainian state cartographic agency, involving experts from the Academy of Sciences of Ukraine and other institutes, as the first serious attempt to map the disaster's impact.
What can we learn from the Chernobyl maps today?
They highlight the importance of transparency, prompt evacuation, and containment in nuclear safety. They also serve as a baseline for ongoing research on radiation's effects on health and the environment.
Browse the Shop
 Acacia frida deluxe solid wood bed frame |
Bedroom bench |
Bed chest drawers |
Lingerie dresser |
Frame base |
Mirror with jewelry storage |
30 Bathroom Vanity |
Memory foam queen mattress |
Mattresses for back pain |
Nightstand set of 2 |
Grand Goldman Shop |
Civil Lawyer
Deutschland Trikot WM 2026