The unified geologic map of the Moon is the most complete cartographic record of our satellite ever assembled, translating 4.5 billion years of impacts and volcanism into a single, color-coded visual. Released in 2020 by the U.S. Geological Survey (USGS), it combines data from NASA's Lunar Reconnaissance Orbiter (LRO) and Japan's Kaguya orbiter to give scientists and the public an unprecedented view of lunar history.
With the success of Artemis II and the Orion spacecraft's recent splashdown after the first crewed lunar mission in over 50 years, the Moon is back in the spotlight. This map offers a timely reminder that our satellite is far more than a cratered backdrop—it's a Rosetta Stone for understanding planetary evolution.
Find Original Home Decor sparking conversation at Grand Goldman Shop.

What Is the Unified Geologic Map of the Moon?
The map is a global, 1:5,000,000-scale representation of the lunar surface, derived from six previously digitized geologic maps. It was created by the USGS in collaboration with NASA and the Japan Aerospace Exploration Agency (JAXA), using high-resolution data from LRO and Kaguya. For the first time, the entire lunar surface is depicted with a consistent set of geologic classifications.
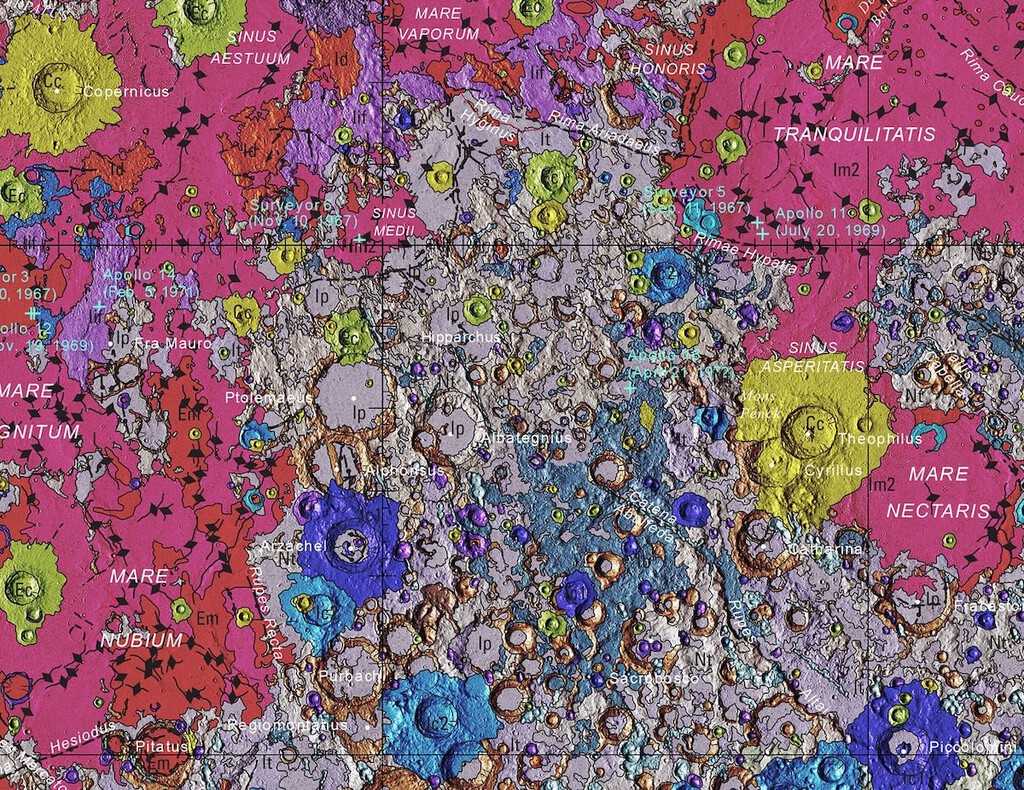
You can view a general version online or download the full-resolution map for detailed study. The sheer number of craters is striking, but the real story lies in the colors—each hue represents a specific type of terrain with a distinct age and origin.
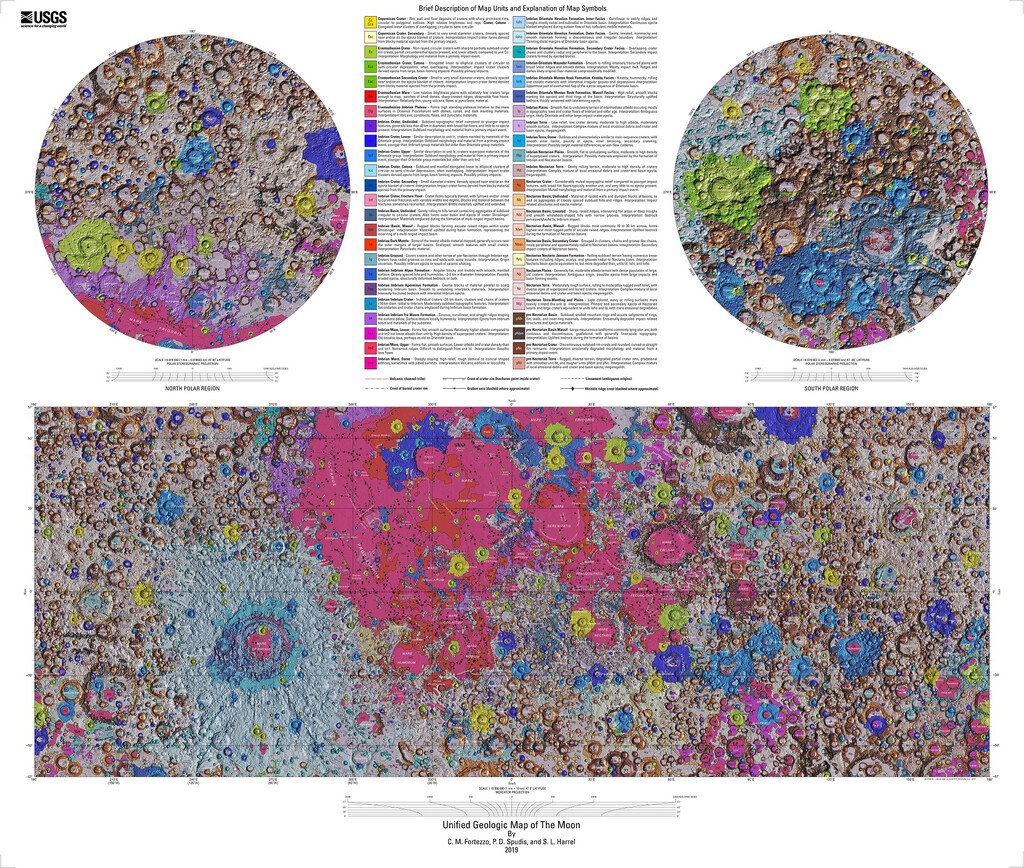
How the Map Was Made
Researchers integrated data from multiple sources, including topographic measurements, spectral data, and photographic imagery. They then assigned each unit a color based on its geologic characteristics. The result is a seamless map that shows the Moon's surface as never before.
Reading the Colors: What Each Shade Tells Us
The color scheme is not ornamental; it's a scientific tool. Different colors indicate different rock types, ages, and formation processes. For example, ancient lava plains are shown in one color, while impact ejecta from younger craters appear in another. This allows anyone to instantly identify whether they're looking at an old volcanic plain, a fresh crater, or a complex highland region.
The map also distinguishes between materials formed by impact processes (like crater rims and ejecta blankets) and those formed by volcanism (like mare basalts). By studying the distribution of these units, scientists can reconstruct the sequence of events that shaped the lunar surface.
Why This Map Matters for Lunar Science
The unified map provides a foundation for future lunar exploration. It helps planners identify safe landing sites, locate resources like water ice, and understand the geologic context of samples returned by missions like Apollo and, eventually, Artemis. It also serves as a reference for comparing the Moon with other rocky bodies in the solar system.
Moreover, the map highlights the Moon's violent history. Each crater is a record of an impact event, and each lava flow marks a period of volcanic activity. Together, they tell the story of a world that has been shaped by internal and external forces over billions of years.
Key Takeaways from the Map
- The map is the first comprehensive, unified geologic map of the entire Moon.
- It was created by the USGS using data from NASA's LRO and Japan's Kaguya orbiter.
- Colors represent different geologic units, each with a specific age and origin.
- The map is available at a scale of 1:5,000,000 and can be downloaded for detailed study.
- It provides critical context for future lunar missions, including Artemis.
Comparing Lunar Geologic Maps
Before this unified map, lunar geologic maps were fragmented, covering only specific regions or using inconsistent classifications. The new map integrates all previous efforts into a single, coherent framework. The table below summarizes the key differences.
| Feature | Previous Maps | Unified Map (2020) |
|---|---|---|
| Coverage | Regional or incomplete | Global |
| Scale | Varies | 1:5,000,000 |
| Data Sources | Limited | LRO, Kaguya, and others |
| Classification | Inconsistent | Unified |
| Accessibility | Mostly technical | Publicly available |
What to Watch Next in Lunar Exploration
The map will be invaluable as NASA and its partners prepare for the Artemis missions, which aim to return humans to the Moon and establish a sustainable presence. Future missions will likely target regions with high scientific value, such as the lunar south pole, where water ice may be present. The unified map will help identify these targets and plan safe traverses. The longer history behind the story is traced in Unified Geologic Map of the Moon: 4.5 Billion Years in One View.
Additionally, the map will aid in the selection of samples for return to Earth. By understanding the geologic context of a landing site, astronauts can collect samples that answer key questions about the Moon's history and evolution. The background to this story is set out in Opencast Mining Risks: How It Reawakens Dormant Geological Faults. A related thread runs through Local AI Hardware: Why Apple's Unified Memory Beats Cloud NAS. Earlier coverage in Science: latest articles shows how the argument developed.
The Moon as a Window to the Solar System
The Moon preserves a record of the early solar system that has been erased on Earth by plate tectonics and erosion. By studying lunar rocks and surfaces, scientists can learn about the conditions that prevailed when the planets formed. The unified map is a tool that makes this record accessible to researchers and the public alike. A closer look at the same subject appears in NASA's Lunar Base Construction Begins with $100M Contracts. Anyone following the wider picture can start with Artemis II Success but NASA's Ambitious Lunar Plan Faces Delays. The same theme surfaces in China Finds Fluorescent Moon Mineral That Could Transform LED Bulbs, which takes a different angle.
As we look forward to future missions, the map reminds us that the Moon is not a dead world but a complex and dynamic one, with a history that is still being written. Context on how this played out before sits in Interactive Map Reveals 5.4 Million Earthquakes Worldwide. A companion piece, Interactive Map Reveals the Entire Global Power Grid, approaches the same subject from another angle.
FAQ
What is the unified geologic map of the Moon?
It is a comprehensive, global map of the lunar surface created by the USGS in 2020, using data from NASA's LRO and Japan's Kaguya orbiter. It classifies the entire Moon's geology at a scale of 1:5,000,000.
Why are there different colors on the map?
Each color represents a distinct geologic unit with a specific age and origin. For example, ancient lava plains are shown in one color, while impact ejecta from younger craters appear in another.
How can I access the map?
The map is available online through the USGS, and you can download it for detailed study. It is publicly accessible and used by scientists, educators, and space enthusiasts.
What does the map tell us about the Moon's history?
The map reveals the distribution of impact craters and volcanic plains, helping scientists reconstruct the sequence of events that shaped the Moon over 4.5 billion years.
Browse the Shop
 Acacia frida deluxe solid wood bed frame |
Bedroom bench |
Bed chest drawers |
Lingerie dresser |
Frame base |
Mirror with jewelry storage |
30 Bathroom Vanity |
Memory foam queen mattress |
Mattresses for back pain |
Nightstand set of 2 |
Grand Goldman Shop |
Civil Lawyer
Deutschland Trikot WM 2026